This is "1H NMR Spin-Spin Splitting: An Introduction" from the book 32 Weeks of OChem (v. 1.0).


1H NMR Spin-Spin Splitting: An Introduction
Learning Objectives
- To use the "N+1" rule to calculate the number of nearest neighbors.
- To recognize characteristic splitting patterns.
- To recognize leaning multiplets and associate them with coupling.
We have seen how to use some of the information in a proton NMR spectrum.
- We know how to use the chemical shift to identify functional groups.
- We know how to use the integration to figure out the number of equivalent protons.
With this page we will dig a little further and see how we can use the splitting patterns presented by the peak group to learn a little bit about the proton environment.
Signal Splitting Patterns
The hydrogens on carbons adjacent to the carbon with the hydrogens giving the signal will split the signal into a multiplet. This is called "spin-spin coupling." Signals are split according to the n+1 rule. The number of peaks in the multiplet is proportional to the number of hydrogens on the adjacent carbons plus 1. Suppose carbon "A" is connected to carbon "B". If carbon "A" has 3 hydrogens and carbon "B" has 1 hydrogen, the signal from the protons on carbon "A" will be split into a doublet. The signal from the proton on carbon "B" will be split into a quartet. The intensities of the peaks in the multiplet will be in the ratio given by Pascal's triangle as shown below:
Figure 8.1 Pascal's Triangle
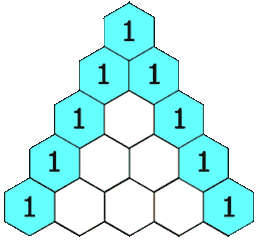
Image Credit: By Hersfold on the English Wikipedia (Own work) [Public domain], via Wikimedia Commons
So using the above example, the doublet from the protons on carbon "A" will appear as a 1:1 split. The quartet for the protons on carbon "B" will appear as a 1:4:4:1 split.
Well, maybe not quite Pascalian
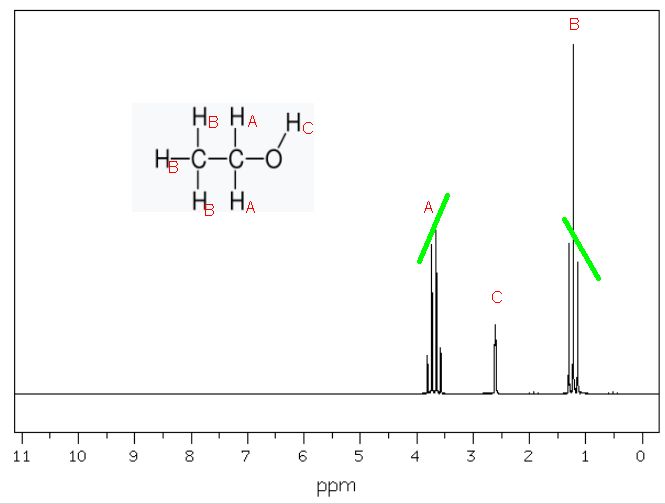
The intensities rarely match up according to Pascal's triangle. Protons split by each other cause the intensity of the most distant signals to be diminished. The effect is known as leaning. The effect is most pronounced in signals that are close to each other in chemical shift. The outside lines are shorter than the inside lines. Consider the 1H NMR spectrum of ethanol shown below.
Figure 8.2 Proton NMR Spectrum of Ethanol
 Spectrum from SDBSWeb : http://sdbs.db.aist.go.jp
(National Institute of Advanced Industrial Science and Technology, October 10,
2017) Structure from Wikipedia .
Spectrum from SDBSWeb : http://sdbs.db.aist.go.jp
(National Institute of Advanced Industrial Science and Technology, October 10,
2017) Structure from Wikipedia .
We expect the protons labelled "A" to be a quartet with intensities 1:4:4:1 by Pascal's triangle. But instead it's more like 0.9:3.7:4:1. Similarly, we expect the protons labelled "B" to be a triplet with intensities 1:3:1. Instead we find 1:3:0.9.
Example 7.1 (Spec)
The three overlaid IR spectra in the graph below are of isomeric alkenes: 1-octene, (Z)-2-octene and (E)-2-octene. Note that the spectral range in the graph is in an expanded view showing the region 2000 cm-1 to 600 cm-1. Assign the IR spectra (A, B or C) to each compound.
Figure 7.3 (Spec) Three Overlain IR Spectra
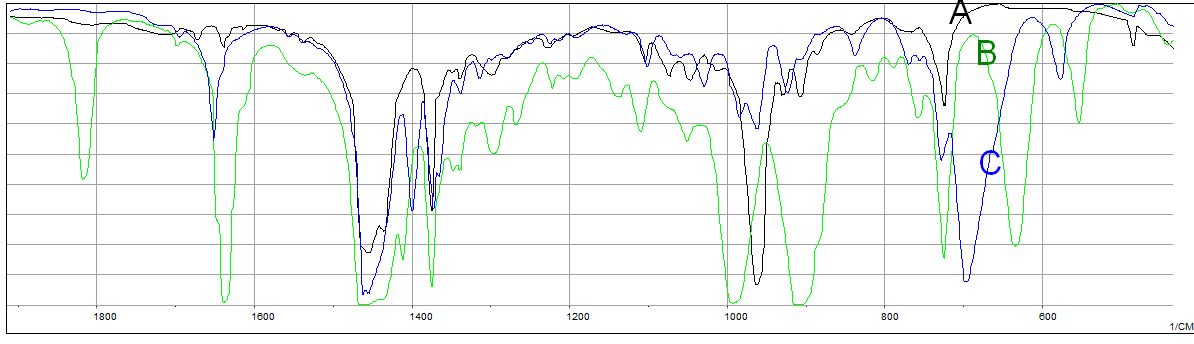
Data from NIST. Graph rendered with JCAMP Viewer, Robert C. Badger, Jonathan C. Badger, UW-Stevens Point
Answer
C=C stretches: The region of the C=C stretching frequency, 1640-1670 cm-1, indicates spectrum B, the green line, has the vinyl group since the intense absorption at 1640 cm-1 is the lowest frequency band in the region. The stereoisomers of 2-octene are a little more arbitrary in this 1650 cm-1 region.
C=C-H bends: Examination of the C=C-H bending region from 650-1000 cm-1 is more informational in this case. Our identification of spectrum B (green) belonging to 1-octene is confirmed. The two intense bands at 990 and 910 cm-1 are very characteristic. Spectrum A presents an intense absorption band at 695 cm-1. This corresponds to a Z configuration. Spectrum C gives an intnse absorption at 963 cm-1 corresponding to an E configuration.