This is "Spectroscopic discernment of substitution patterns of alkenes and alkynes" from the book 32 Weeks of OChem (v. 1.0).


Spectroscopic Discernment of Substitution Patterns of Alkenes and Alkynes
Learning Objectives
- To use the information in an IR spectrum to distinguish cis, trans and terminal alkenes.
- To use the information in an IR spectrum to distinguish internal from terminal alkynes.
When we covered the detection of unsaturation in a hydrocarbon, we didn't dig quite as deep as we could have into some of the information. Now that you have more familiarity with the spectroscopic techniques and nomenclature of organic compounds, we can see how to distinguish cis and trans substitution patterns around a double bond. Of course, by now you realize we are talking about diastereomers. It should click in your mind that an easy way of distinguishing diastereomers is by observing their melting points. This is true. For example, consider oleic acid and its diastereomer elaidic acid.
Figure 7.1 (Spec) Olives being processed before pressing
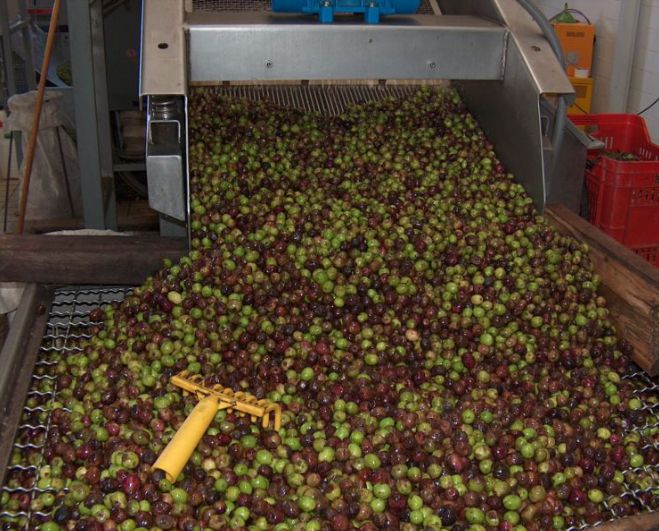
Oil olive extraction: olive fruits after the washing at Frantoio Fratelli Serra in Villacidro (Sardinia, Italy). Olive oil is a mixture primarily composed of the triglyceride of oleic acid. Professional Institute of Agriculture and Environment "Cettolini" of Cagliari (Sardinia, Italy). By Giancarlo Dessi CC3.0 via Wikimedia Commons
Oleic acid, which has a cis configuration about the double bond, has a melting point of 13°C. Elaidic acid, which has a trans configuration, has a melting point of 45°C.
Figure 7.2 (Spec) Structures and Models of Oleic Acid and Elaidic Acid
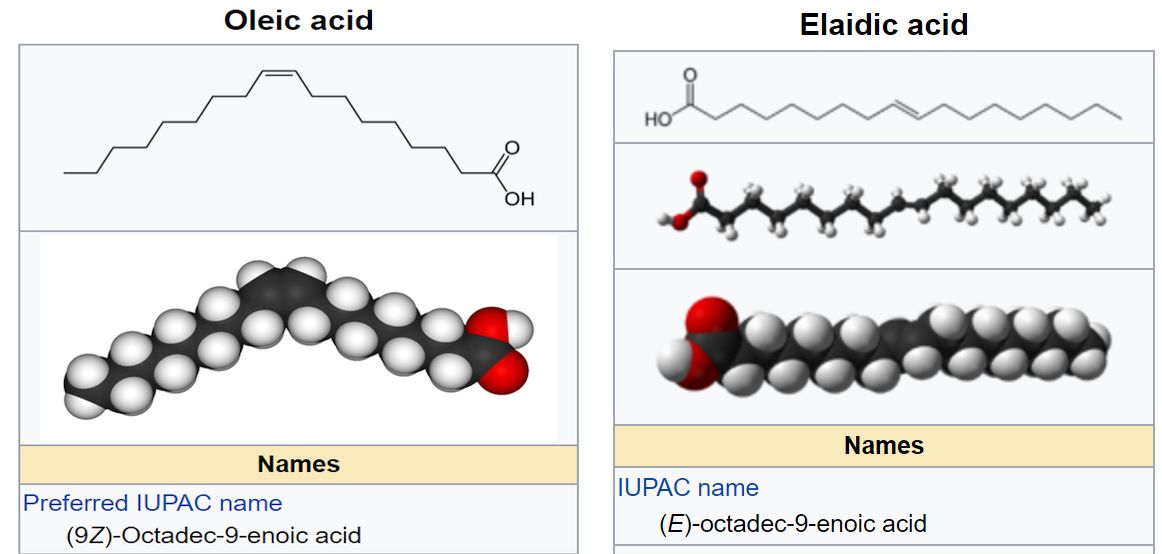
Clipped from the Oleic Acid and Elaidic Acid Wikipedia articles.
But sometimes it is necessary to have more evidence. And, sometimes a melting point isn't possible, for example, some compounds decompose before they melt. We can find evidence of cis or trans by using spectroscopy.
IR (FTIR)
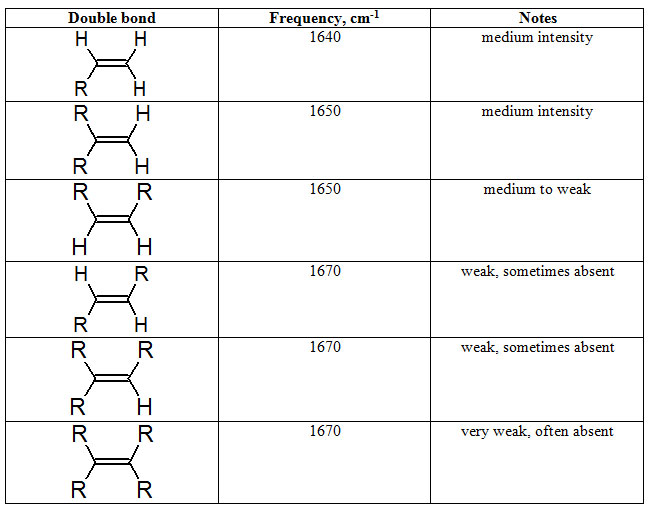
In IR Spectroscopy: Detecting Unsaturation in a Hydrocarbon, we learned bands in the 1680-1630 cm-1 region are characteristic of a C=C stretch. The frequency of this stretch can reveal if the C=C group is vinylic or substituted.
Table 7.1 Typical C=C Streching Frequencies
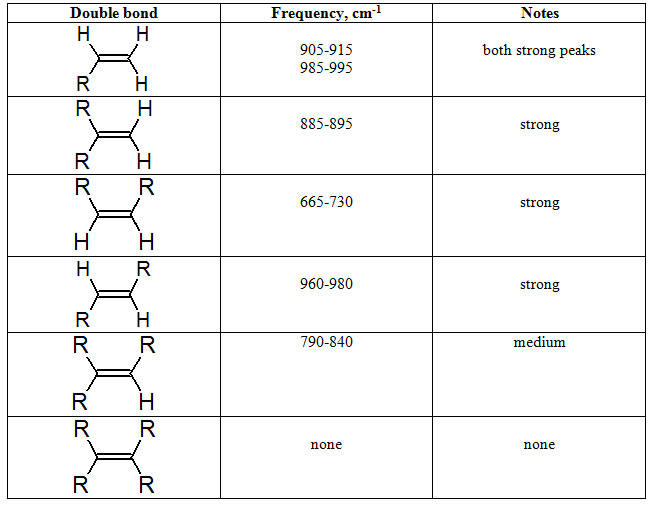
Another informational region with respect to the substituents on the C=C bond is the bending region for C=C-H bonds from 650 to 1000.
Table 7.2 Typical C=C-H Bending Frequencies
IR Characterization of Alkynes
The substitution possibilities for for a C≡C are necessarily more limited than for a C=C. Again we need to consider stretches and bends.
Only terminal alkynes give the C≡C-H stretch. So right away, the presence or absence of a strong peak at 3300 cm-1 characterizes an alkyne as terminal (R-C≡C-H) or internal (R-C≡C-R).
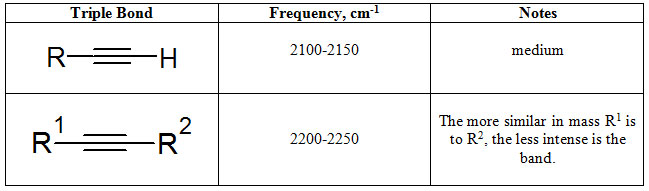
Again, recalling from table 1.2-2, the C≡C stretches occur between 2100 and 2250 cm-1.
Table 7.3 Typical C≡C Stretching Frequencies
The C≡C-H bond of a terminal alkyne shows a characteristic bend that is a strong, broad band between 600-700 cm-1. It has an overtone at twice the wavenumber.
NMR
1H NMR can indeed help distinguish cis and trans protons. Unfortunately, the distinction is just a little beyond our grasp at this point. We'll get there. Be patient. For now, focus your attention on the information in the IR spectrum.
Example 7.1 (Spec)
The three overlaid IR spectra in the graph below are of isomeric alkenes: 1-octene, (Z)-2-octene and (E)-2-octene. Note that the spectral range in the graph is in an expanded view showing the region 2000 cm-1 to 600 cm-1. Assign the IR spectra (A, B or C) to each compound.
Figure 7.3 (Spec) Three Overlain IR Spectra
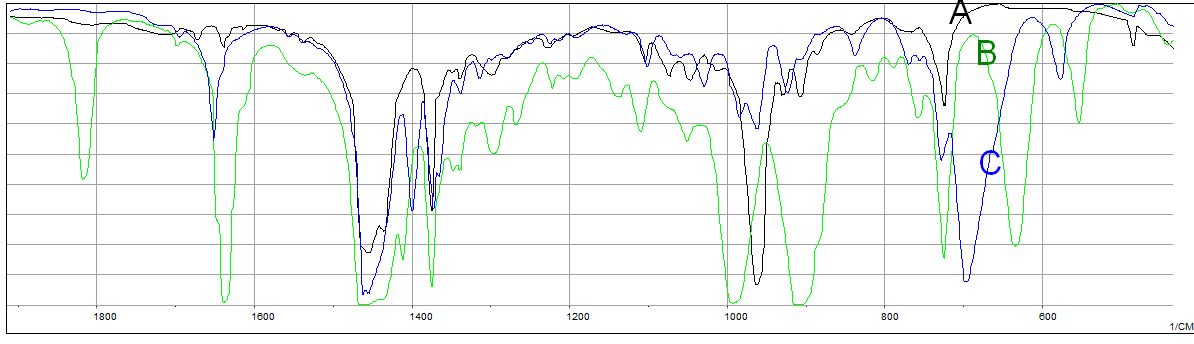
Data from NIST. Graph rendered with JCAMP Viewer, Robert C. Badger, Jonathan C. Badger, UW-Stevens Point
Answer
C=C stretches: The region of the C=C stretching frequency, 1640-1670 cm-1, indicates spectrum B, the green line, has the vinyl group since the intense absorption at 1640 cm-1 is the lowest frequency band in the region. The stereoisomers of 2-octene are a little more arbitrary in this 1650 cm-1 region.
C=C-H bends: Examination of the C=C-H bending region from 650-1000 cm-1 is more informational in this case. Our identification of spectrum B (green) belonging to 1-octene is confirmed. The two intense bands at 990 and 910 cm-1 are very characteristic. Spectrum A presents an intense absorption band at 695 cm-1. This corresponds to a Z configuration. Spectrum C gives an intnse absorption at 963 cm-1 corresponding to an E configuration.