This is "IR Spectroscopy: Detecting Unsaturation in a Hydrocarbon" from the book 32 Weeks of OChem (v. 1.0).
IR Spectroscopy: Detecting Unsaturation in a Hydrocarbon
Learning Objectives
- To have a qualitiative understanding of the theoretical frequency of absorption and intensity with respect to infrared spectroscopy..
- To learn characteristic IR absorption frequencies for saturated and unsaturated aliphatic hydrocarbons.
In the previous structure elucidation section you learned how the 13C-NMR chemical shift can give the hybridization of the carbons and the 1H-NMR chemical shift can indicate if the hydrogens are attached to carbons of double or triple bonds. You also saw how the rings + db formula can be applied to a molecular formula to give the degree of unsaturation. In this section we will introduce Infrared (IR) Spectroscopy with special emphasis given to spotting C=C and C≡C.
IR (FTIR)
Without getting too much into how the instrument works, a few attributes of an FTIR deserve mention. First of all, an FTIR is an affordable piece of instrumentation routinely encountered in an organic chemistry lab. By affordable, we're in the $15,000 range. Fancy sampling devices can add thousands, but help make efficient use of the experimenter's time and talent. Another attribute is durability. With only limited technical skill and routine maintenance, (changing the dessicant, tuning laser, and IR source), the instrument can withstand a decade or longer of student-(ab)use. These two attributes combine to mean the instrument is available for you to use starting this week. We'll never be able to afford an NMR, nor would it be likely we could keep a mass spectrometer running for long in a teaching environment even if we could afford such an instrument. So now it's time to start getting comfortable with the technique.
Figure 2.1 (Spec) A Fourier Transform Infrared Spectrophotometer (FTIR)
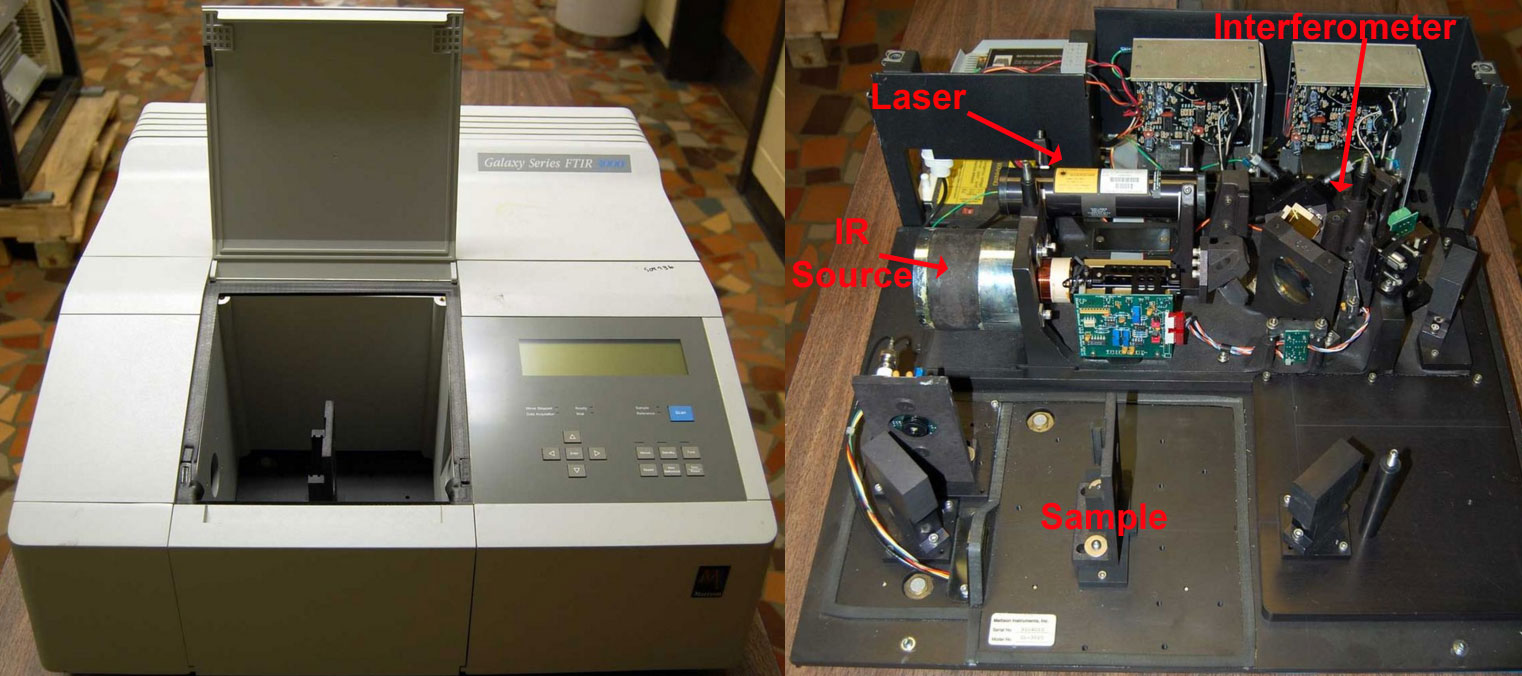
(Left) An FTIR with the sample chamber open. (Right) The same instrument with the housing off. An inner liner has also been removed which protects the KBr optics from moisture. .By Kkmurray (Own work) [CC BY-SA 3.0 (http://creativecommons.org/licenses/by-sa/3.0) or GFDL (http://www.gnu.org/copyleft/fdl.html)], via Wikimedia Commons
A large amount of interpretation of an IR is qualitative but there are also a lot of numbers to memorize; however, do NOT memorize table 2.1 (spec), below.
Table 2.1 (Spec) Average Bond Energies (kJ/mol) adapted from http://chemwiki.ucdavis.edu/Core/Theoretical_Chemistry/Chemical_Bonding/General_Principles_of_Chemical_Bonding/Bond_Energies
| Single Bonds | Multiple Bonds | ||||||
| C—H |
413
|
N—H |
391
|
C = C |
614
|
||
| C—C |
347
|
C ≡ C |
839
|
||||
| C—N |
305
|
|
C = O* |
745
|
|||
| C—O |
358
|
S—H |
347
|
||||
| C—F |
485
|
N = O |
607
|
||||
| C—Cl |
339
|
O—H |
467
|
||||
| C—Br |
276
|
||||||
| C—I |
240
|
C ≡ N |
891
|
||||
| C—S |
259
|
|
C = N |
615
|
|||
|
*C == O(CO2) = 799
|
|||||||
The take home message is that different bonds have different energies. For IR we often use the analogy that the atoms connected by a bond are like masses on a spring. Looking at the table above, we can see a single bond is lower energy than a double bond which is lower energy than a triple bond. The spring analogy says the spring gets stiffer as we go from a single bond to a triple bond. Continuing the analogy, the stretching frequency of a heavy mass attached to a spring is slower than the stretching frequency for a spring attached to a lighter mass. This difference in frequency associated with different mass matches the observations from Table 2.1 (Spec). The reason for introducing this bit of theory is that it helps one remember the relative region of stretching frequencies in an IR spectrum.
The IR experiment is vibrational, meaning the bonds are made to bend and stretch with the IR energy. Table 2.1 (Spec) helps you rank the IR absorption frequency. The intensity of the absorption is proportional to the change in dipole moment. When the dipole moment does not change during a vibration, it is IR silent. Big dipole moment changes mean big absorption intensities. Small dipole moment changes mean small absorption intensities. For example, note how in Table 2.2 (Spec) that symmetric double bonds and symmetric triple bonds are practically silent with respect to C=C and C≡C stretches.
Table 2.2 (Spec) Typical Absorption Frequencies adapted from http://chemwiki.ucdavis.edu/Core/Organic_Chemistry/Spectroscopy/Infrared_Spectroscopy
Stretching Vibrations |
Bending Vibrations |
|||||
|---|---|---|---|---|---|---|
Functional Class |
Range (cm-1) |
Intensity |
Assignment |
Range (cm-1) |
Intensity |
Assignment |
Alkanes |
2850-3000 | str | CH3, CH2
& CH 2 or 3 bands |
1350-1470 1370-1390 720-725 |
med med wk |
CH2 & CH3
deformation CH3 deformation CH2 rocking |
Alkenes |
3020-3100 1630-1680 1900-2000 |
med var str |
=C-H & =CH2 (usually sharp) C=C (symmetry reduces intensity) C=C asymmetric stretch |
880-995 780-850 675-730 |
str med med |
=C-H & =CH2 (out-of-plane bending) cis-RCH=CHR |
Alkynes |
3300 2100-2250 |
str var |
C-H (usually sharp) C≡C (symmetry reduces intensity) |
600-700 | str | ≡C-H deformation |
There is a lot of information in table 2.2 (Spec). The five points below need to be memorized from this table this week.
From the stretches-
- The C-H stretch in an alkane is below 3000 cm-1. The =C-H stretch of an alkene is pointy and between 3000 and 3300 cm-1. The ≡C-H stretch of an alkyne is pointy and above 3300 cm-1.
- The C=C bond stretch appears between 1630 and 1680 cm-1. Another C=C bond stretch appears between 1900 and 2000 cm-1.
- The C≡C bond stretch is between 2100 and 2250 cm-1.
From the bends-
The business from 1350 to 1470 cm-1 can reveal alkyl groups and deserves some attention.
- A doublet of two identical peaks centered around 1380 cm-1 indicates an isopropyl group. A doublet where one peak is larger than the other in this region indicates a t-butyl group.
- A peak at 1450 cm-1 indicates a -CH2- (methylene) group. A peak at 1375-1385 cm-1 indicates a -CH3 (methyl) group.
Example 2.1 (spec)
The following compounds are structural isomers with the molecular formula C10H18.
Figure 2.1 (Spec) Structural Isomers
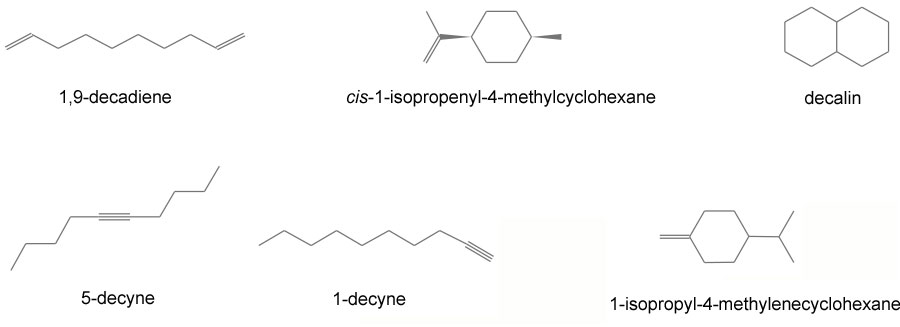
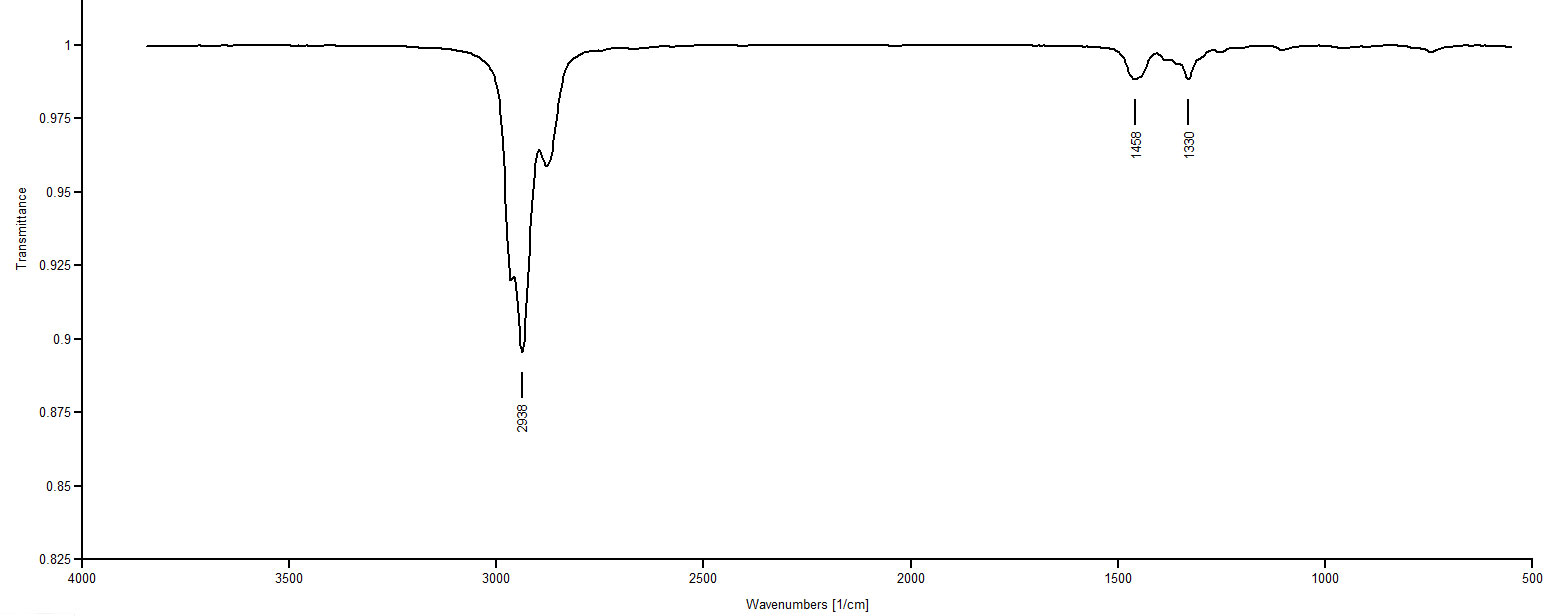
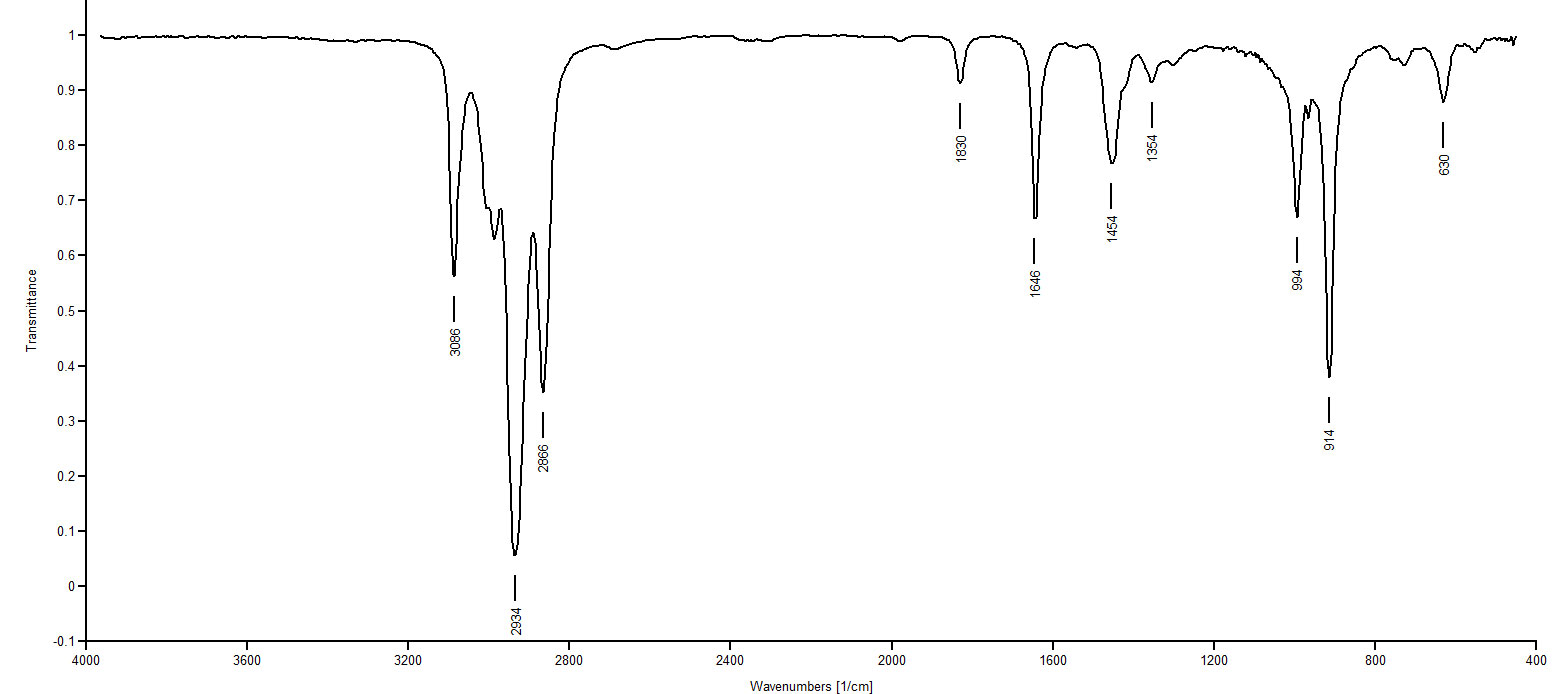
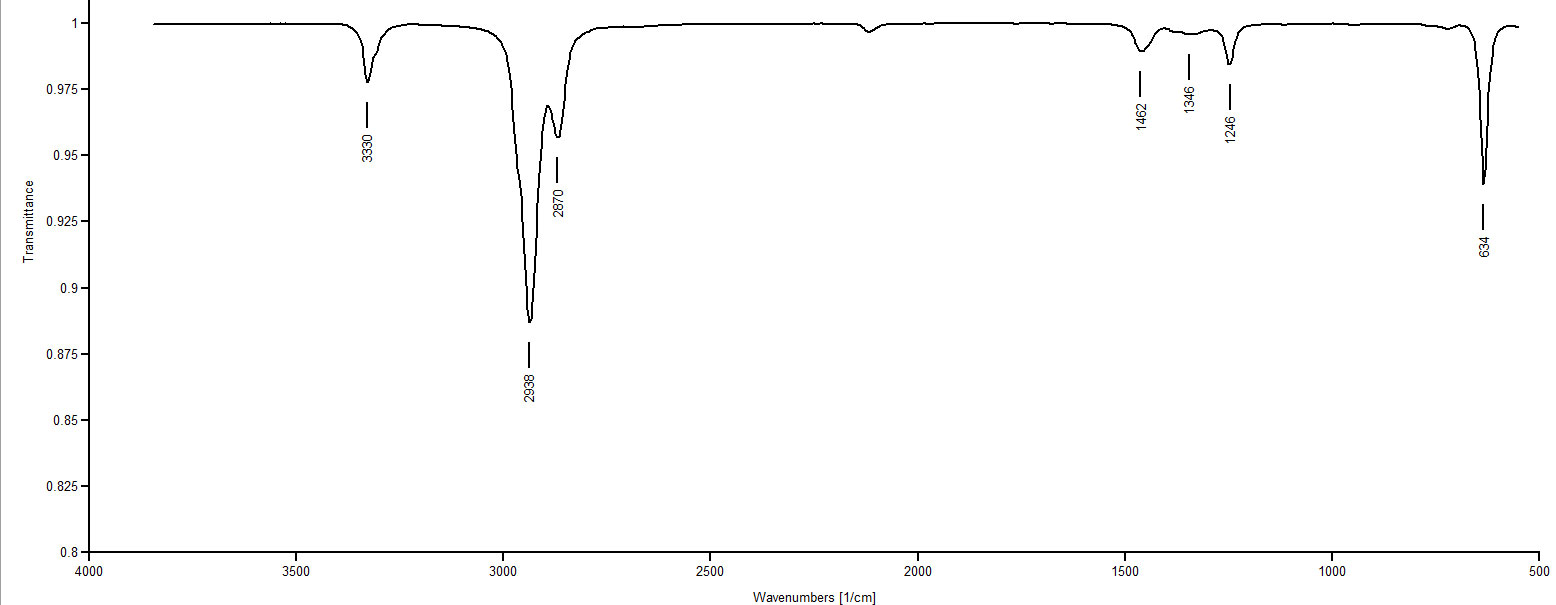
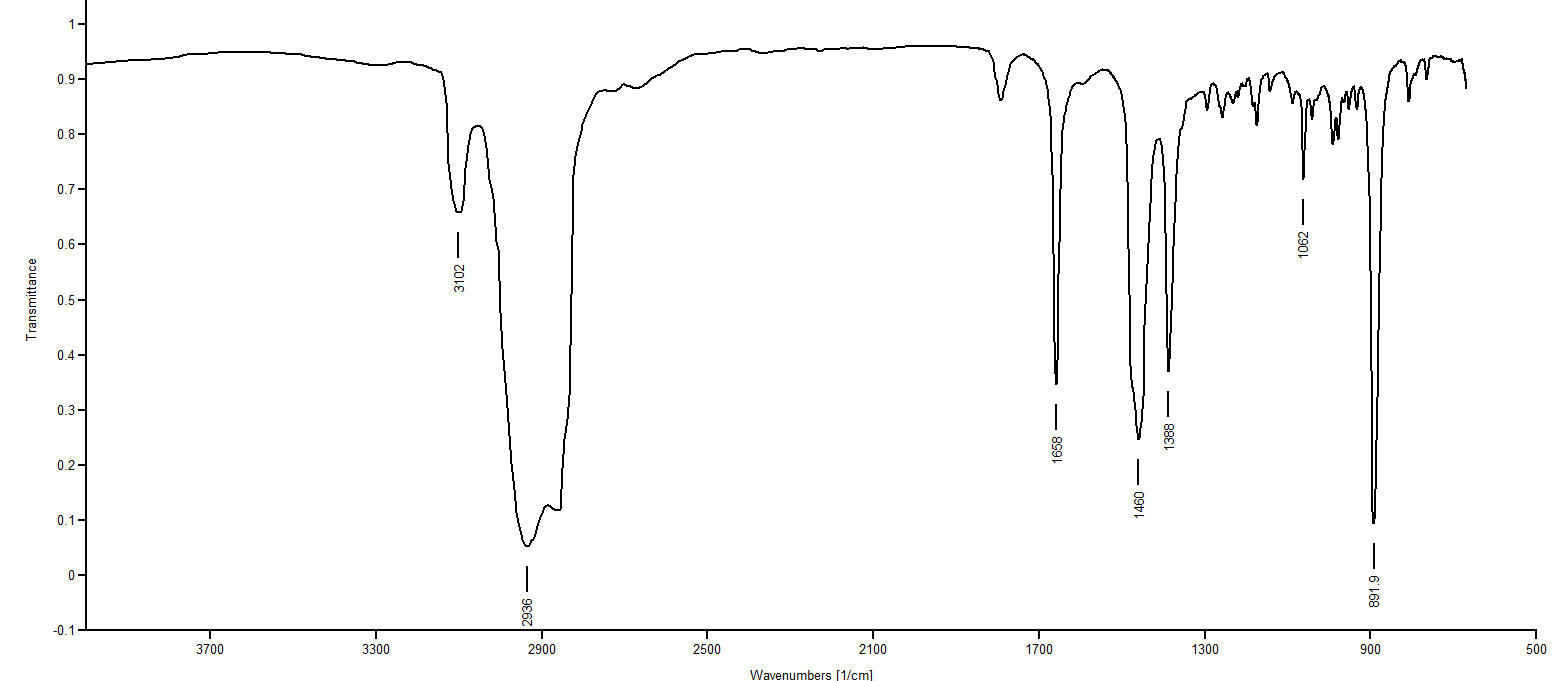
Use the information in this lesson to match each spectrum below with its compound (above). Some zoom might be required on the spectra to read the frequencies.
IR Spectrum 1
IR Spectrum 2
IR Spectrum 3
IR Spectrum 4
IR Spectrum 5
IR Spectrum 6
Answer
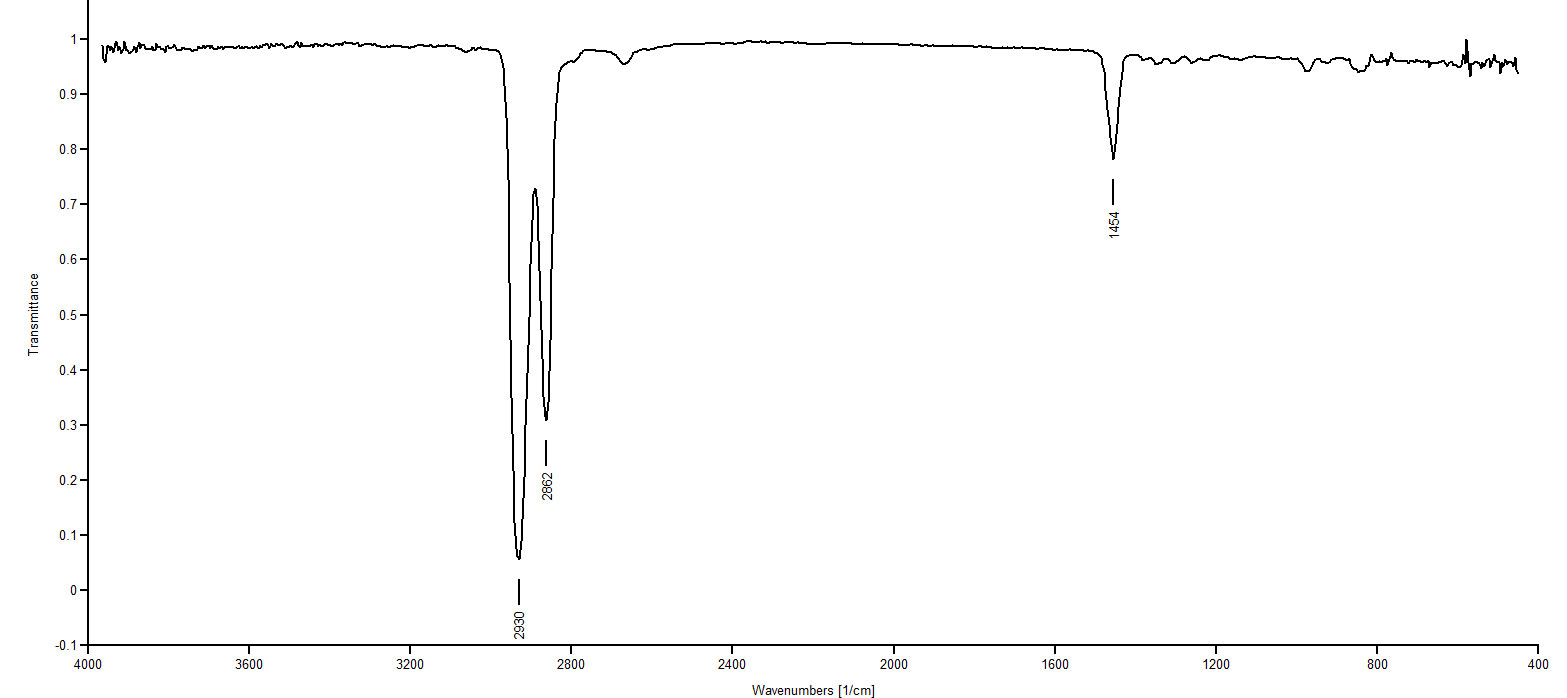
IR Spectrum 1: The peaks at 2930 and 2862 are just C-H stretches of an ordinary alkane. At 1454 we see -CH2 (methylene) deformations. Most remarkable is the fact there is no absorption in the 1370-1390 region, which indicates no CH3 group. So IR Spectrum 1 must be decalin.
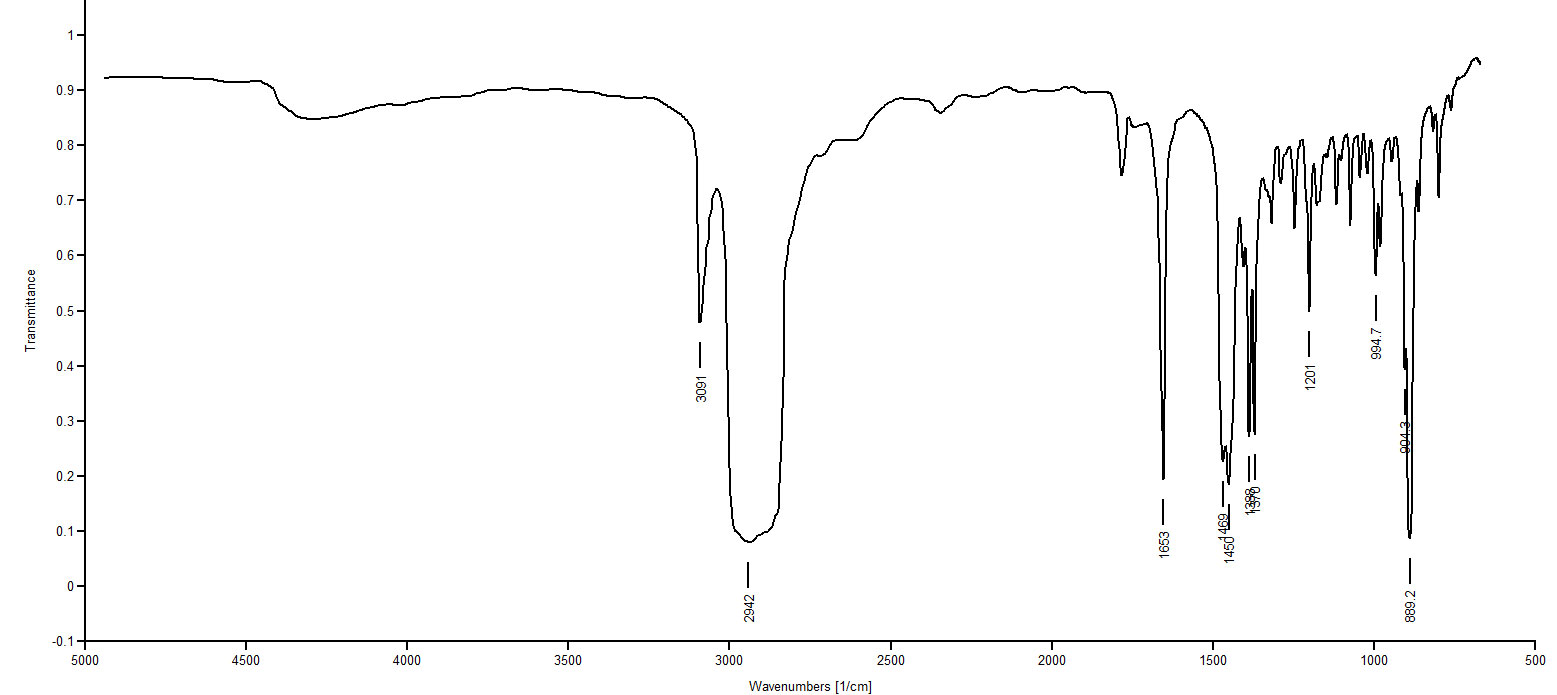
IR Spectrum 2: IR spectra 2, 4 and 6 are all showing absorptions in the 3020-3100 region. This region indicates =C-H streches. Three of our choices present structures with a =C-H: 1,9-decadiene, cis-1-isopropenyl-4-methylcyclohexane and 1-isopropyl-4-methylenecyclohexane. Spectra 2, 4 and 6 also present aborptions around 1650, the C=C stretching frequency, confirming the presence of a C=C. Most remarkable about spectrum 2 is the doublet appearing at 1370 and 1388. This indicates an isopropyl group. Of the trio of choices we are considering, only 1-isopropyl-4-methylenecyclohexane presents an isopropyl group. So Spectrum 2 must be1-isopropyl-4-methylenecyclohexane.
IR Spectrum 3: Only two compounds remain that could possibly be matched with Spectrum 3: 1-decyne and 5-decyne. One of these two compounds matches Spectrum 3 and the other matches Spectrum 5. Spectrum 3 shows no peak around 3300 (≡C-H stretch), whereas Spectrum 5 shows a peak at 3330. So Spectrum 3 must be an internal alkyne since there is no evidence of a ≡C-H. Spectrum 3 must be 5-decyne.
IR Spectrum 4: 1,9 decadiene and cis-1-isopropenyl-4-methylcyclohexane remain as possibilities. This is going to be the toughest call of the set. Looking at the structures, one notices 1,9-decadiene has no methyl groups while cis-1-isopropenyl-4-methylcyclohexane offers two methyl groups. Looking at Spectrum 4 in the 1370-1390 region for the CH3 deformation we see nothing for certain. Spectrum 4 must be 1,9-decadiene.
IR Spectrum 5: By elimination we know this must be 1-decyne. The peak at 3330 is clearly from a ≡C-H.
IR: Spectrum 6: Again, by elimination this must be 1-isopropenyl-4-methylcyclohexane. The peak at 1388 cm-1 indicates the methyl group's presence.


