This is "Spectroscopic Detection of Oxygen in Organic Compounds" from the book 32 Weeks of OChem (v. 1.0).
Spectroscopic Detection of Oxygen in Organic Compounds
Learning Objectives
- To interpret a mass spectrum of a compound which may contain oxygen.
- To know characteristic IR bands for alcohols, ethers, aldehydes, ketones, carboxylic acids and esters.
- To be able to associate 13C and 1H NMR chemical shift information with the presence of oxygen atoms in a compound.
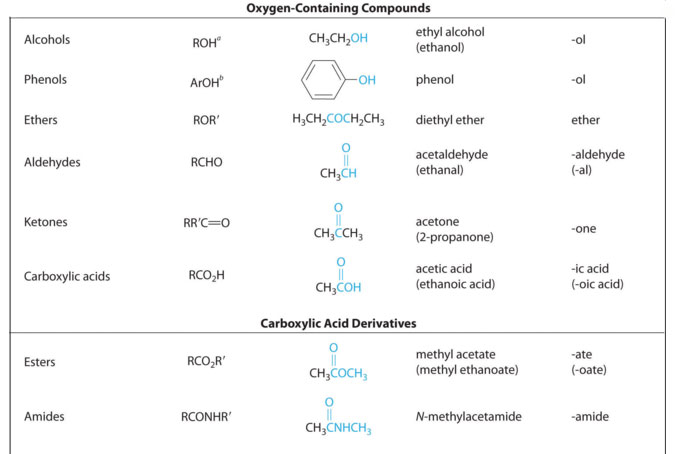
Way back in general chemistry we learned the valence of oxygen is two. Meaning it forms two bonds in neutral compounds. In terms of families of organic compounds, this presents lots of possibilities. A few are shown in table 3.1 (Spec). The easiest spectroscopic technique for spotting oxygen atoms is the IR and that's the technique we will spend most of the time discussing in this section. At the conclusion of this section we'll give some NMR chemical shifts that indicate oxygen, but as a suggestion, check the IR first and then you can look for confirmation of your hunches from the NMR.
Table 3.1 (Spec) Organic Families with Oxygen Atoms
IR (FTIR)
O-H stretches
From the table of bond energies in last week's spectroscopy page, Table 2.1 (Spec), you can find the C-H bond energy is 413 kJ/mol, while the O-H bond energy is 467 kJ/mol. Whereas the C-H stretch is pretty typically 2800-3000 cm-1, the O-H stretch is a little higher. Whereas the C-H stretch gives a relatively sharp absorption, the O-H stretch is broadened in condensed phases due to hydrogen bonds. Figure 3.1 (Spec) below shows a couple of typical O-H stretches in an overlaid specxtrum.
Figure 3.1 (Spec) Overlaid IR Spectra
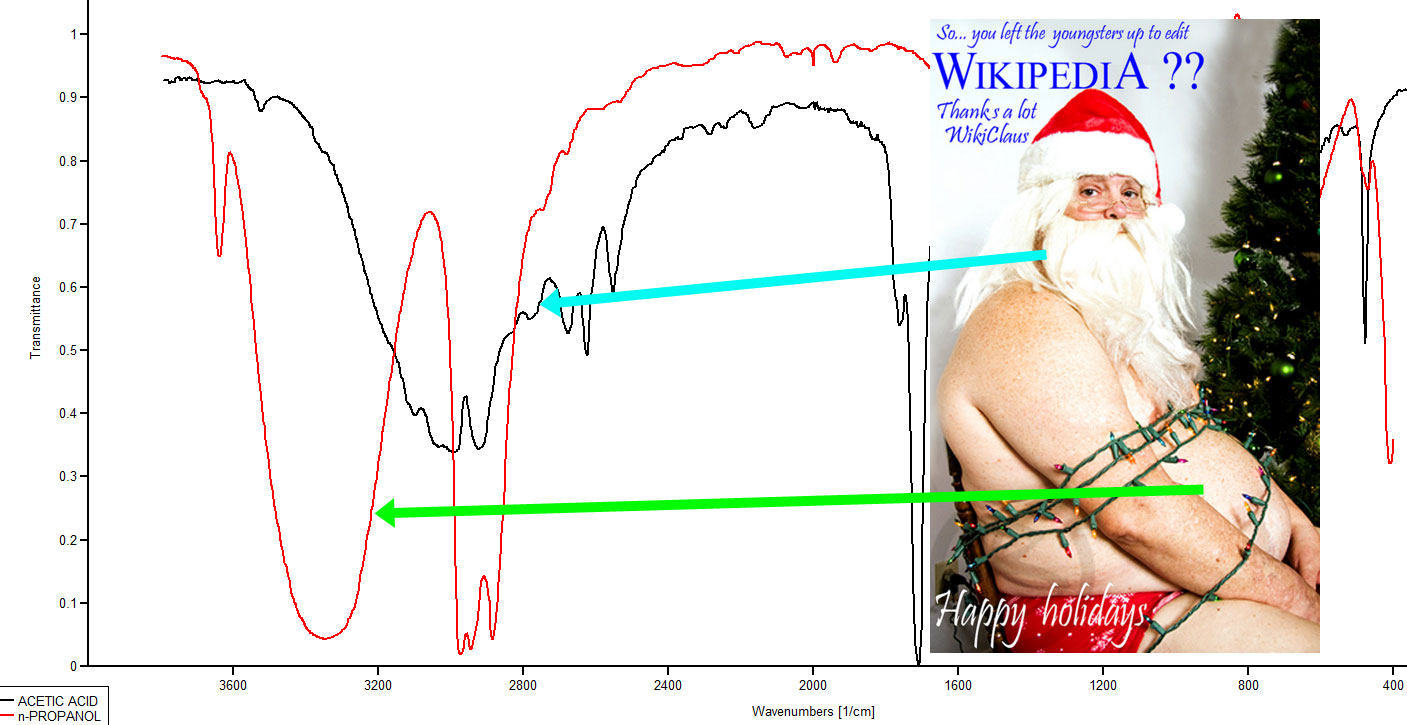
The red line spectrum (lower most) is of 1-propanol and the black line is the spectrum for acetic acid. The green arrow is comparing the old man's belly to the OH stretch of an alcohol and the blue arrow is comparing an old man's beard to the carboxylic acid's OH stretch. The inset photo is a Christmas card from Wikipedia. The caption read "Wikiclaus visited a house where, unknown to him the youngsters were allowed to stay up past midnight... editing Wikipedia. He scolded them for being up so late and they captured him and tied him down with Christmas lights, so they could get back to editing. Happy holidays." By MichaelQSchmidt (Own work) [CC BY-SA 4.0 (http://creativecommons.org/licenses/by-sa/4.0)], via Wikimedia Commons .
C-O Stretches, O-H bends & Various Combinations Thereof
Intense, sometimes broad, peaks in the region between 1000 and 1300 cm-1 can most likely be attributed to the presence of an oxygen atom. Trying to be more specific and pin down exactly what vibration is associated with what peak would probably be unhealthy at this stage of the game.
C=O Stretches
Among the most obvious features to look for in the IR spectrum is a very intense peak around 1700 cm-1. In terms of memorization, the number to carry with you is 1715 cm-1 which is the frequency of a carbonyl stretch in an ordinary ketone. Most other families present C=O stretching frequencies at higher wave numbers. The exception being amides. Also, conjugation of the C=O bond always lowers the streching frequency.
Table 3.2 (Spec) C=O Stretching Frequencies
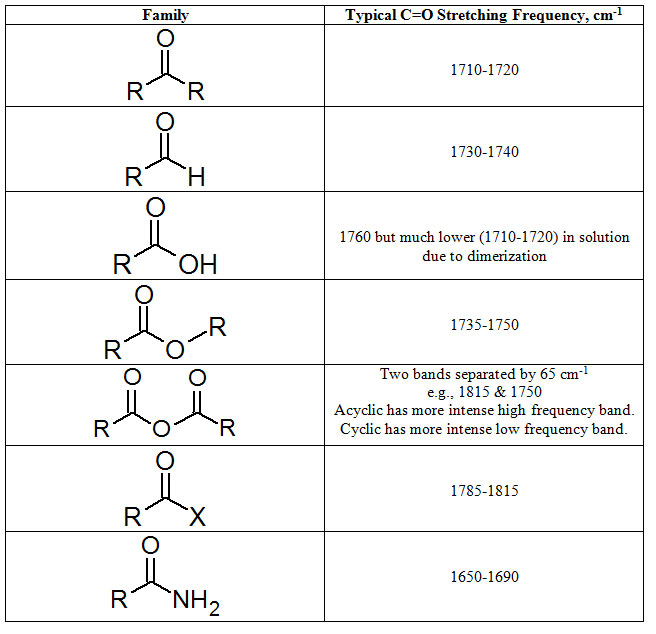
Figure 3.2 (Spec) Overlaid IR Spectra Showing C=O Stretches
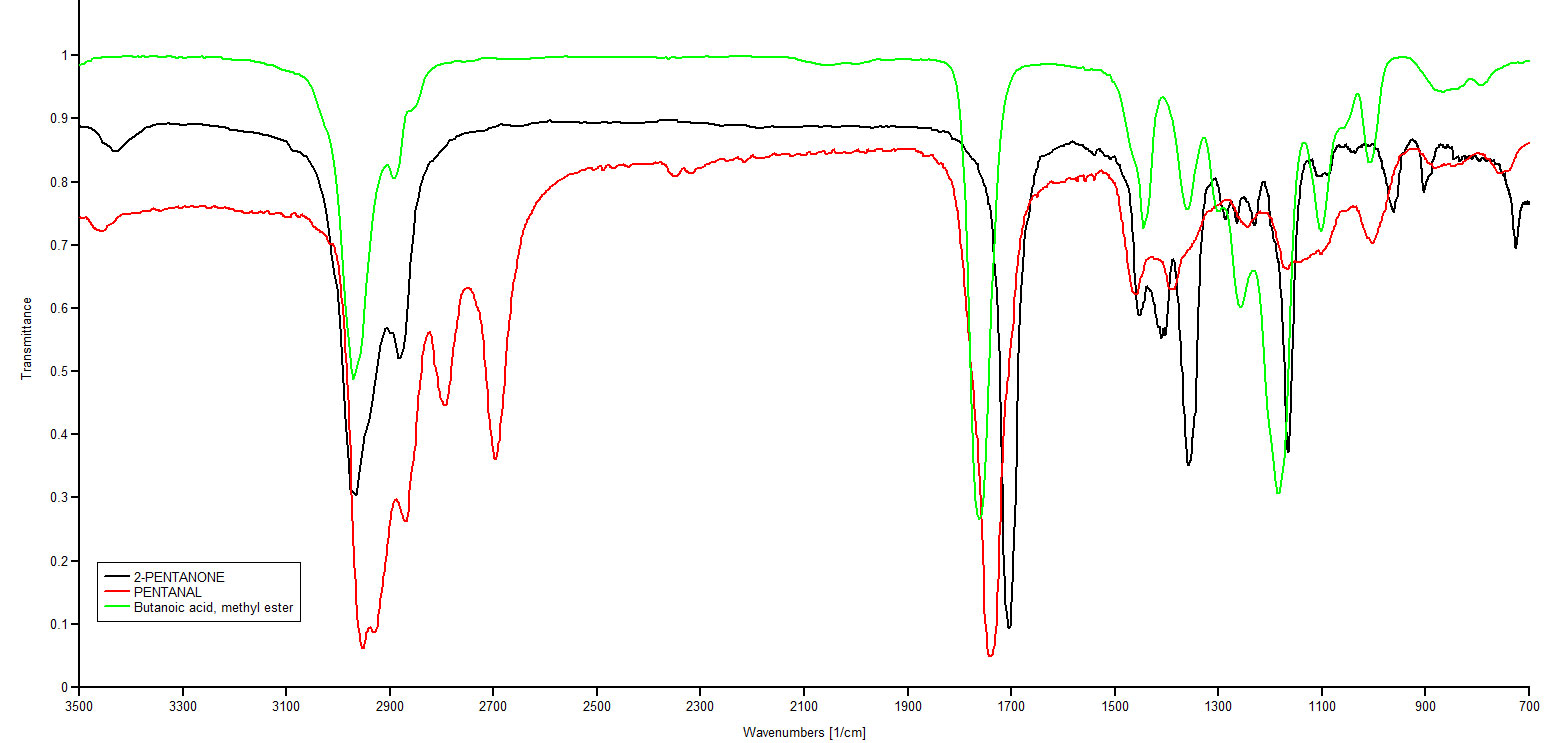
The black line spectrum is of 2-pentanone, the red line spectrum (lower most) is pentanal and the green line (top most) is the spectrum for methyl butanonoate. Note the C=O stretching absorptions at 1705 cm-1 (2-pentanone), 1742 cm-1 (pentanal) and 1762 cm-1 (methyl butanoate). The absorption at 2700 cm-1 is a indication of an aldehyde functional group. It is associated with a C-H stretch unique to aldehydes. Spectral data is from NIST and is displayed with Spekwin 32 from Friedrich Menges.
NMR
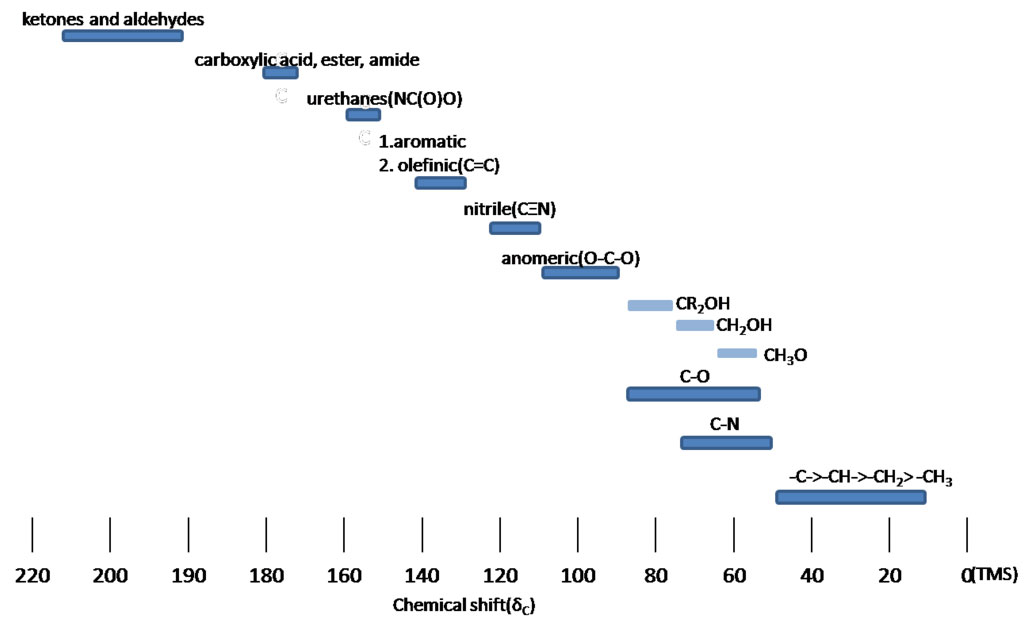
Both 1H NMR and 13C NMR can indicate the presence of an oxygen atom. Mostly the NMR gives confirmation through the chemical shift of the peaks. Below are helpful tables. With practice, you will incidently memorize this information. You probably don't need to memorize either table just yet.
Figure 3.3 (Spec) 1H NMR Chemical Shifts
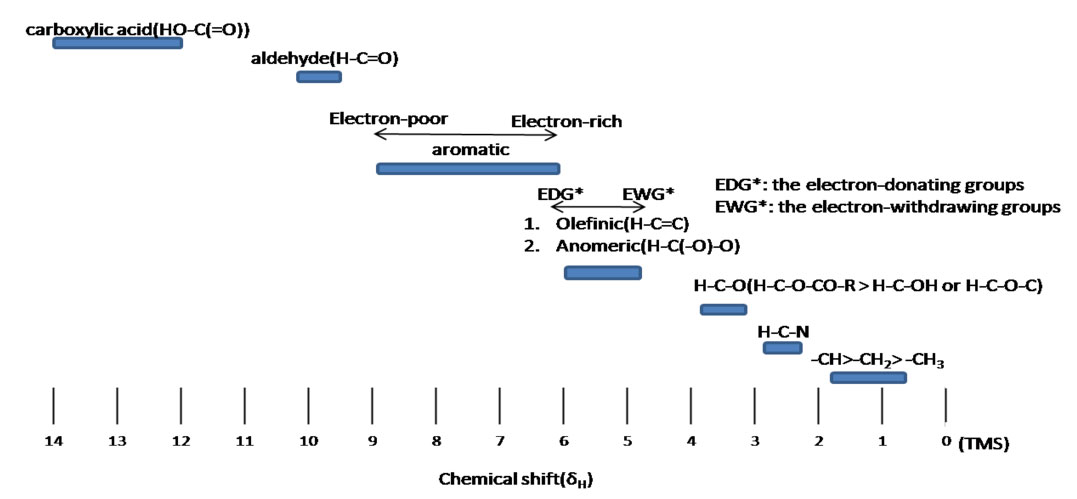
Table from the Chemistry LibreTexts Project.Attribution-NonCommercial-ShareAlike 3.0 United States (CC BY-NC-SA 3.0 US)
Figure 3.4 (Spec) 13C NMR Chemical Shifts
Example 3.1 (spec)
Identify the unknown compound using the following four spectra.
Figure 3.5 (Spec) Mass Spectrum
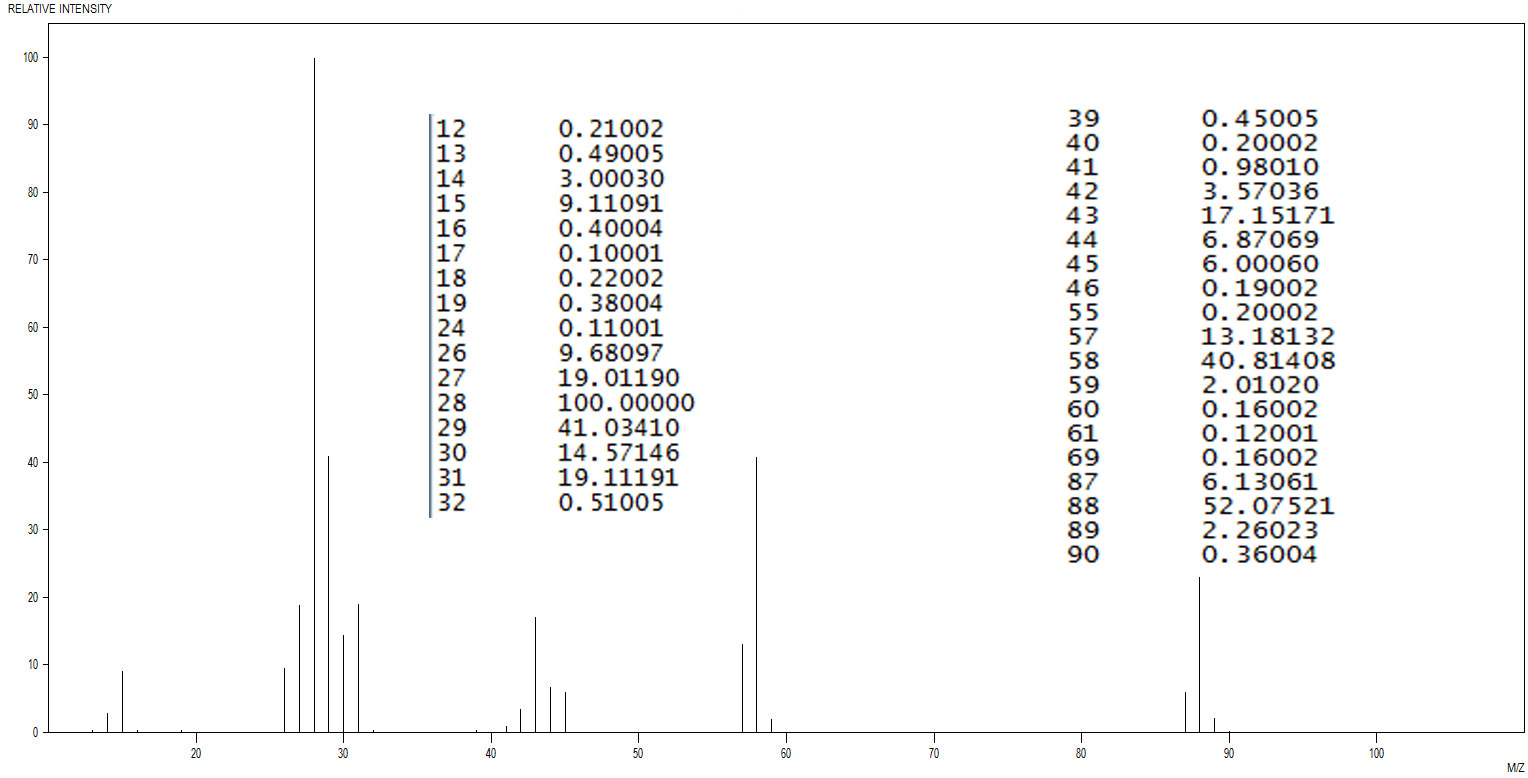
Figure 3.6 (Spec) IR Spectrum
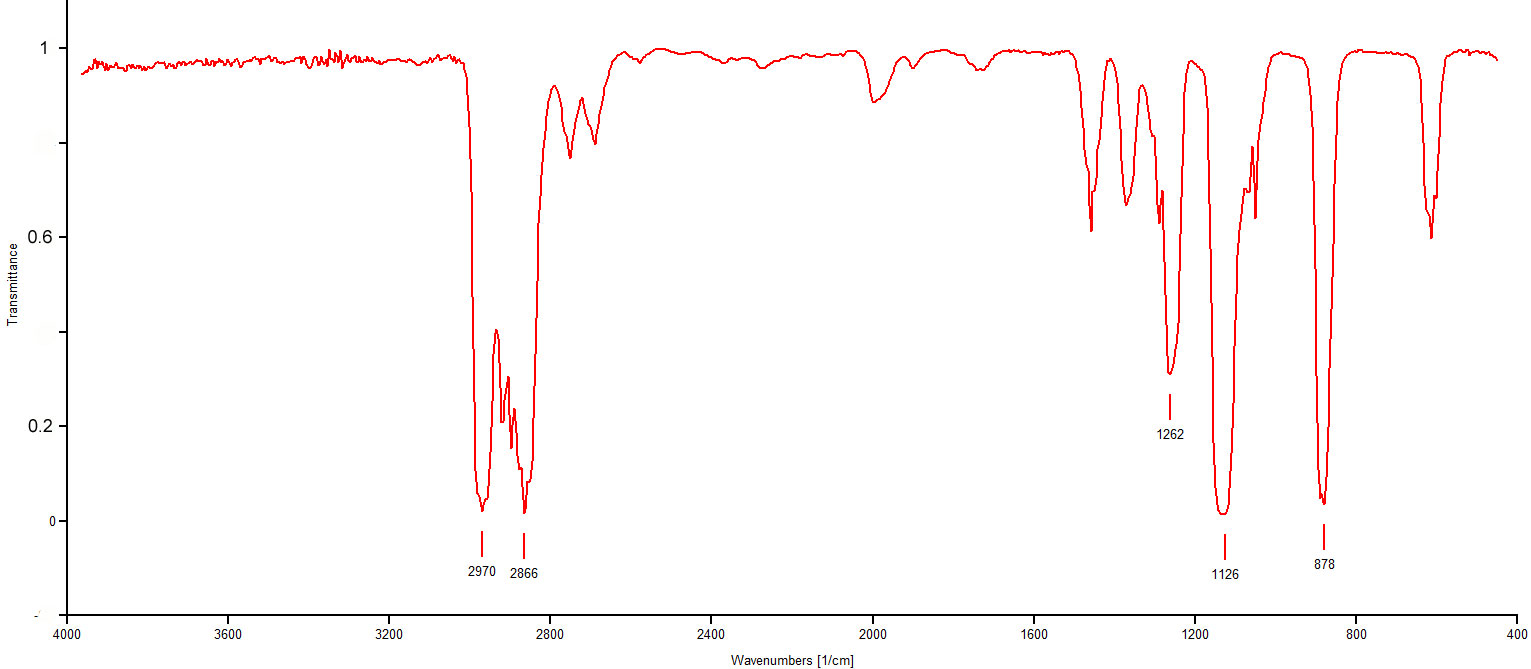
Figure 3.7 (Spec) 13C NMR Spectrum
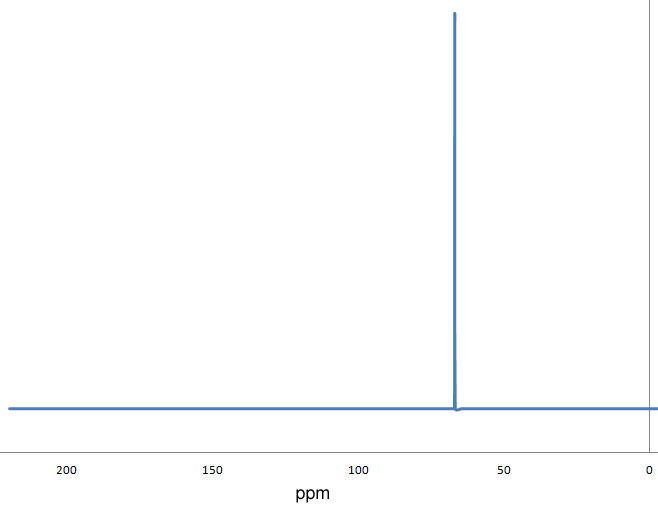
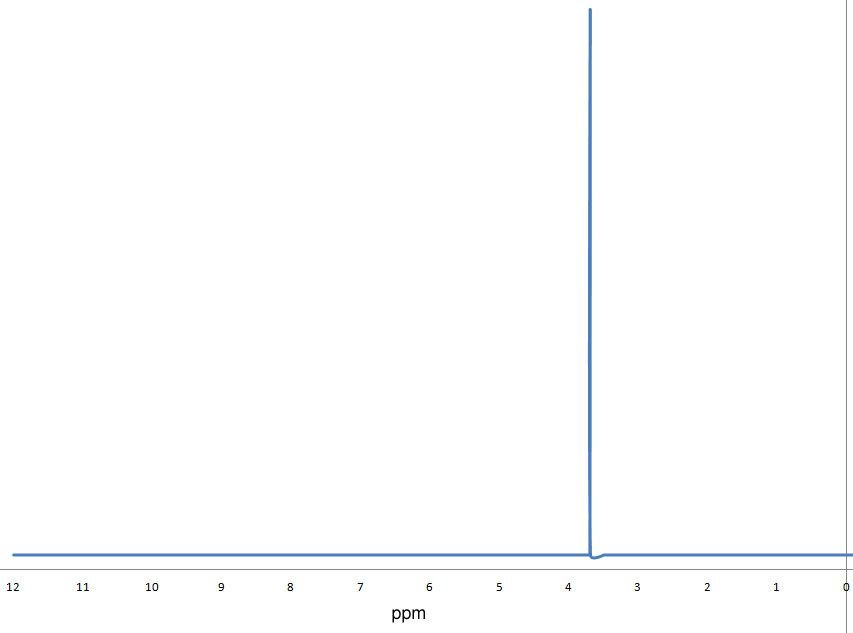
Figure 3.8 (Spec) 1H NMR Spectrum
Answer
Step 1: Identify the probable M+ ion in the mass spectrum (Figure 3.5 (Spec)). The most likely candidate is at 88 m/z. The peak at 89 is probably the 13C isotopic peak. Normalize the peaks by dividing 100 by the intensity at 88.
Now apply the normalization factor to the peak intensity at 89.
1.9203 × 2.26023 = 4.3403
Divide the normalized abundance by the natural abundance of 13C (1.1%).
So, it looks like 4 carbons in the M+.
To get to a mass of 88 with just carbon and hydrogen would require a formula of C4H40 which of course is impossible. Look for oxygen.
Step 2: The mass spectrum in Figure 3.5 (Spec) does hint at the presence of oxygen because of the number of carbons and the presence of an (M+2)+ peak at 90. Note, the M+2 associated with oxygen is due to the presence of 18O; however, the abundance of 18O is so low (0.2%), the inevitable random error makes it pretty difficult to say for sure if oxygen is present or how many O atoms there might be. Check out the IR in Figure 3.6 (Spec). The band at 1126 cm-1 is intense and somewhat broadened. It looks like a C-O stretch. It would be wise at this point to figure out a probable molecular formula including oxygen. If we guess the presence of one oxygen atom, we would get the molecular formula C4H24O and again, considering valence requirements, is impossible. Try two oxygen atoms and we'd have C4H8O2. Aha!
Step 3: Applying the rings + double bonds formula to C4H8O2 gives 1 ring or double bond.
Step 4: Still considering the IR spectrum, we want to look for Santa's beard or belly. Neither are present, nor is a C=O stretch indicated in the spectrum. Elimination of these functional groups leaves us with an ether functionality being present in the compound.
Step 5: Consider the 13C NMR's chemical shift. The peak at 67 ppm falls well within the C-O range indicated in Figure 3.4 (Spec). This is confirmation of an ether functionality.
Step 6: Consider the 1H NMR chemical shift. The peak at 3.7 ppm is maybe a little high for an ether, but still within the range indicated in Figure 3.3 (Spec).
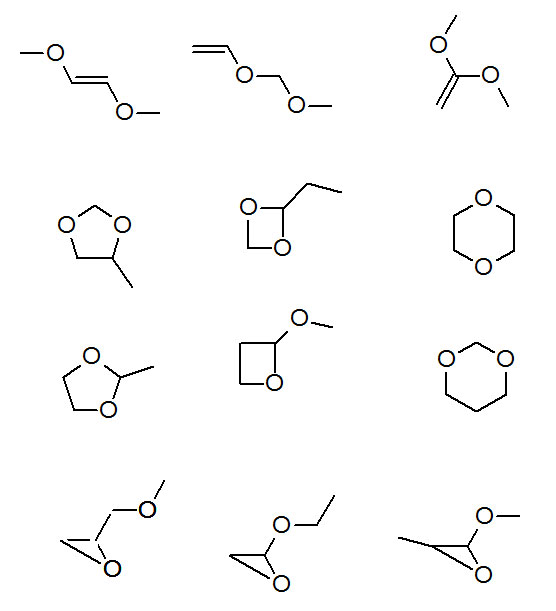
Step 7: Pause and consider the possibilities by drawing structural isomers of C4H8O2 that present ether functionality.
Figure 3.9 (Spec) Structures of Candidates
Let's see what we can eliminate from the possibilities:
Figure 3.6, the IR spectrum, shows no bands in the C=C-H region 3020 cm-1 to 3100 cm-1. Figure 3.7, the 13C NMR, shows no peaks in the 130-145 ppm region. Figure 3.8, the 1H NMR, shows no peaks in the 5-6 ppm region. We can eliminate all the C=C possibilities. This must be a ring compound.
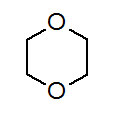
Figures 3.7 and 3.8, the 13C NMR and 1H NMR show only one kind of carbon and one kind of hydrogen. There's only one structure that presents so much symmetry, 1,4-dioxane.
Figure 3.10 (Spec)Structure of 1,4-dioxane
