This is "Deduction of the Molecular Formula of a Hydrocarbon" from the book 32 Weeks of OChem (v. 1.0).


Deduction of the Molecular Formula of a Hydrocarbon
Learning Objectives
- To be able to identify the molecular ion and its isotopic peak from a mass spectrum.
- To be able to calculate a molecular formula from a mass spectrum.
- To be able to deduce the degree of unsaturation using the rings + double bonds formula.
- To use the information revealed in the broad band decoupled 13C NMR experiment to determine the number of unique carbon atoms.
- To recognize symmetry in a molecule and differentiate chemically equivalent from chemically non-equivalent carbon atoms.
- To use a 1H NMR experiment's integration to determine the number of hydrogen atoms.
Atoms are too small to see. For that matter collections of thousands of atoms are still too small to see. So, how do we know what atoms are present in a compound and how do we know the connectedness of those atoms? There are several tools of the trade chemists can employ. Most typically a chemist has access to an infrared spectrum (IR), a mass spectrum (MS) and a nuclear magnetic resonance spectrum (NMR). In many organic chemistry textbooks spectroscopy is set aside in two or three separate chapters somewhere in the middle of the textbook. In this course we are glossing over the physics, some of which isn't necessary to totally understand, and diving head first into the interpetration of the spectra. The physics is interesting; however, at this stage of the game, we can have a whole lot of fun and learn a tremendous amount about these compounds just by charging straight to the spectra. You should not expect any one week's worth of "spec" sections in this supplement to be a complete story for any experimental technique. The only goal of these sections is to give you enough information to enable you to do the week's problems. Every other week we will kick up the complexity for each of the three spectra. Stick with these "spec" sections and by the end of 32 weeks, you can be among the best prepared undergraduate students in the world with respect to spectroscopic determination of organic structures. Take little steps and make them FUN!
In the interpretation of spectra, you will run into a lot of "maybes." One experiment rarely unequivocally determines the structure of a compound. You deduce a structure by making guesses and eliminating possibilities. In this section, our goal is to figure out the molecular formula of a hydrocarbon. We'll see some experiments that lead to this determination. Armed with a molecular formula, we can list structural isomers of the formula. We can then use some results of our experiments that can reveal the presence of symmetry. After we recognize symmetry, or lack thereof, we can maybe determine some structures.
MS
Figure 1.1 (Spec) A Mass Spectrometer

The 1 MV accelerator mass spectrometer at Lawrence Livermore National Laboratory http://bioams.llnl.gov/equipment.php 14C and tritium analyses of biomedical samples submitted by Resource users are conducted using this 1 MV system. The AMS spectrometer consists of a cesium sputter source, low-energy injection beam line, the high voltage collision cell (accelerator), a high-energy mass spectrometer and a particle detector for energy measurements (proceeding clockwise from lower left in the photograph).This image is a work of a United States Department of Energy (or predecessor organization) employee, taken or made as part of that person's official duties. As a work of the U.S. federal government, the image is in the public domain via Wikimedia Commons.
Simply put, a mass spectrum is a graph showing the masses and abundances of all the ions that result when you smash a molecule with a hammer. There are lots of places to read about the scales used to weigh the ions and the hammers used to smash the molecules but that discussion is left to others. Remember, we're cutting right to the chase and learning how to elucidate structures from spectra.
Oftentimes, but not always, and maybe not even usually, it's possible to get a molecular formula from the mass spectrum. One quick and dirty approach is to look at the highest mass region of the spectrum with the hopes of spotting what is called the peak group for the molecular ion, M+•. For this quick and dirty trick to work you need to identify a pair of peaks in the M+•. The taller and lighter mass peak is from the M+• ion where all of the carbons are 12C. The peak next door is called the (M+1)+•, or "isotopic peak." This isotopic peak comes from an ion which has one 13C instead of a 12C as in the base peak. This peak is called the M+1 isotopic peak. Nature has endowed the earth with 1.1 13C atoms for every 100 C atoms. With this knowledge we can do some arithmetic.
- Normalize the base peak; i.e., multiply it's intensity by some number to make it 100.
- Multiply the intensity of the isotopic peak by this same normalization factor you applied to the base peak. This is called the "normalized isotopic peak" intensity.
- Divide the normalized isotopic peak's intensity by 1.1. This is the approximate number of carbons in the compound which must of course be an integer.
- Take the difference between the mass of the base peak and the number of carbons × 12. This is the number of hydrogens.
This quick and dirty approach will work 100% of the time for the spectra in our first several weeks of problems. But keep in mind, this is still tee-ball.
If you know the molecular formula, then you can calculate the number of rings + π bonds.
Equation 1-1 (Spec) Rings + Double Bonds formula (aka, Degree of Unsaturation or Index of Hydrogen Deficiency)
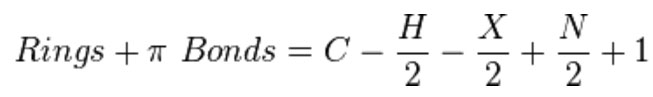
Credit: https://en.wikipedia.org/wiki/Degree_of_unsaturation
Where C = number of carbons, H = number of hydrogens, X= number of halogens and N = number of nitrogens. Divalent atoms like oxygen never contribute a term to this R + DB equation. It's easier to remember in words. Take the number of C atoms, subtract half the number of monovalent atoms, skip the divalent atoms, add half the number of trivalent atoms and then add 1. Remember, a hydrocarbon that has no rings or double bonds has 2n + 2 hydrogen atoms.
NMR
Figure 1.2 (Spec) An NMR Spectrometer

By Mike25 (Own work) [Public domain], via Wikimedia Commons
The NMR experiment distinguishes nuclei in molecules and gives a glimpse of their nuclear environment. Without getting into the quantum mechanics, suffice it to say that some nuclei are susceptible to having their spin flipped while other nuclei are not. It's this spin flipping that gives a signal in our NMR spectra. In this course we'll be flipping 13C nuclei and 1H nuclei.
13C-NMR
We will use three types of 13C experiments for our spectra in this course.
- Distortionless Enhancement of Polarization Transfer (DEPT)
- Off-Resonance Proton Decoupled
- Broad Band Proton Decoupled
Broad Band Proton Decoupled: Great for counting equivalent carbons. Each carbon gives a singlet.
The placement of the signal on horizontal scale on the spectrum is called the chemical shift. This is a relative scale comparing the signal to that from a reference compound. Typical 13C chemical shifts are shown below in Table 1.2-3.
Table 1.1 (Spec) Some 13C chemical shifts adapted from http://chemwiki.ucdavis.edu/Core/Physical_Chemistry/Spectroscopy/Magnetic_Resonance_Spectroscopies/Nuclear_Magnetic_Resonance/NMR%3A_Experimental/NMR%3A_Interpretation

1H NMR
This technique uses the same instrument as shown in figure 1.1-3. Historically, the 1H-NMR experiment came first; however, extracting structural information from 1H-NMR spectra can be a little more complicated than it is from the 13C-NMR data. We'll only consider one 1H-NMR experiment. Again, chemical shift, i.e., the position of the peaks on the horizontal axis is very informative. There are two other important bits of information we can get from a 1H-NMR that are not considered for 13C-NMR. The area under the peaks can be integrated to quantify the number of hydrogens. This is called "integration." Also, the signals are split by the protons on neighboring carbon atoms. This is called "signal splitting pattern" So that's three pieces of information we need to extract from our 1H NMR spectra-
- chemical shift
- integration
- signal splitting pattern
Chemical Shift
Table 1.2 (Spec) Some 1H chemical shifts adapted from http://chemwiki.ucdavis.edu/Core/Physical_Chemistry/Spectroscopy/Magnetic_Resonance_Spectroscopies/Nuclear_Magnetic_Resonance/NMR%3A_Experimental/NMR%3A_Interpretation

Integration
The area of the curve under each peak is often displayed as a line plotted above the spectrum. The height from one plateau to another gives the relative number of equivalent protons moving from left to right across the spectrum. Rather than an integration line, sometimes the number of protons is displayed above the peak group.
Example 1.1 (spec)
Use the information below to deduce the molecular formula of this unknown hydrocarbon.
Figure 1.3 (Spec) Mass Spectrum

Figure 1.4 (Spec) 1H-NMR Spectrum

Figure 1.5 (Spec) 13C-NMR Broad Band Decoupled Spectrum

Answer
Starting with the mass spectrum, the peak at m/z = 72 (Relative intensity=12.90129) appears a likely M+•. The peak next to it at m/z = 73 (Relative intensity = 0.70007) is its isotopic peak. Let's do the calculation:
This is our normalization factor and it gets applied to the isotopic peak.
(7.7512)(0.70007)=5.43124
Taking into account the known abundance of 13C of 1.1%,
So there's around 5 carbons, could be 4, could be 6 but most likely 5. If there were 4 carbons, we'd need 72-48 = 24 hydrogens and there's no way to get 24 hydrogens on 4 carbons. Consider 6 carbons. 6 carbons would be a mass of 72 learving no hydrogens. Again, impossible. So we've got our molecular formula, C5H12. We could call this done since the question only asked for a molecular formula. We've got other information though and it's enough to give us the structure.
Apply the rings + double bond equation (Equation 1-1 (Spec):
r+db=5 - + 1 = 0
Indicating a saturated (no multiple bonds), acyclic (not a ring) hydrocarbon. The lack of multiple bonds is confirmed by the chemical shifts in both the 1H-NMR and 13C-NMR spectra. This means there are only three possible structures to consider.
Figure 1.6 (Spec) Possible C5H12 Isomers

The 13C-NMR tells us there are just 3 non-equivalent carbon atoms. Due to symmetry, pentane only presents 3 non-equivalent carbons.
Figure 1.7 (Spec) Pentane

2,2-dimethylpropane presents just 2 non-equivalent carbons, while 2-methylbutane presents 4 non-equivalent carbons. So the 13C-NMR information confirms our molecular formula of C5H12 and indicates the compound is pentane.
Consideration of the 1H-NMR spectrum and integration is also consistent with pentane. The integration of 3 at 0.88 ppm are in fact the 6 identical hydrogens on carbons labeled "A". The integration of 2 at 1.30 ppm are the 4 identical hydrogens on carbons labeled "B". And the integration of 1 at 1.26 ppm are the 2 identical hydrogens on carbon "C".
As we move through these spectroscopy pages in lab, every other week we will learn how to dig more information out of these spectra. Spectroscopy is a wonderful way of putting the scientific method to work. Our spectra are reproducible obervations from controlled experiments. We apply mathematical reasoning to make guesses. We apply further deductive reasoning to uncover confirmation of the accuracy of our guess. Interpretation of spectra is one way we "see" molecules.