This is "Acid-Catalyzed Hydrolysis of Sucrose", from the book 32 Weeks of OChem (v. 1.0).


Acid-Catalyzed Hydrolysis of Sucrose
Learning Objectives
- To recognize an acetal and hemiacetal linkage.
- To write the mechanism for acid-catalyzed hydrolysis given a disaccharide's structure.
- To use a polarimeter to monitor reaction progress.
- To measure the rate constant of a first order reaction by creating a plot of ln[] vs time.
- To create a titration curve.
- To determine the identity of an unknown acid.
- To recognize a carboxyl group.
- To distinguish between the acid, base, conjugate acid and conjugate base..
- To know how to use a pKa table to predict the direction of an acid base reaction.
- To be able to write a reaction mechanism including a proton transfer step.
You may have encountered a product called "invert sugar." When ordinary sugar (sucrose) is heated in acid, the product is "invert sugar." More on that word "invert" later. For example, when sugar is heated in the presence of fruit (citric acid), the product is called jelly or jam. We all know jelly is way sweeter than the sugar or the fruit that went into it. We also know that jelly is smooth and not a crystalline solid. Glucose and fructose are more soluble in water than is sucrose.
Figure 3.1 (Lab) Jelly Doughnut
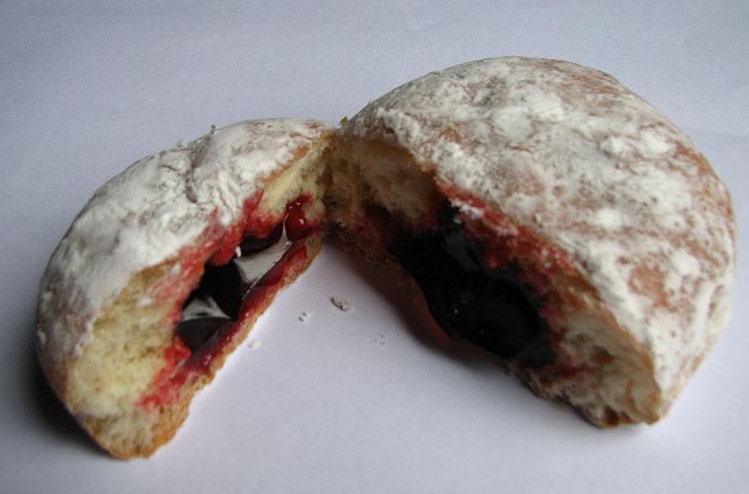
The powdered sugar on the doughnut is sucrose. The jelly filling contains the invert sugar (1:1 mixture of glucose and fructose). Image Credit: By Kevin Payravi (Own work) [CC BY-SA 3.0 (http://creativecommons.org/licenses/by-sa/3.0) or GFDL (http://www.gnu.org/copyleft/fdl.html)], via Wikimedia Commons
The Chemistry
Figure 3.2 (Lab) Sucrose Hydrolysis
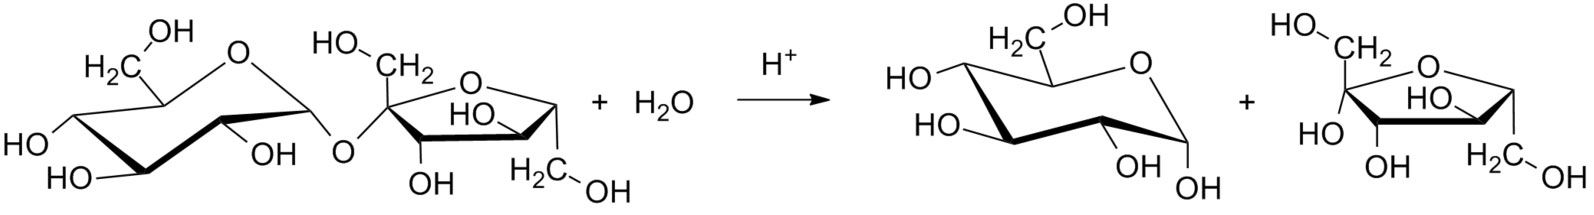
By Iamthealchemist at en.wikipedia [CC0], via Wikimedia Commons
A reasonable mechanism starts with a proton transfer step at the oxgen atom joining the two rings. A heterolysis step may yield a carbocation from the glucose ring and a neutral fructose molecule as a leaving group. The carbocation could be subject to attack by a water molecule in a coordination step. The resulting oxonium could by subject to another proton transfer step to a convenient base, such as water.
Back in Gen Chem II, we studied reaction rates. Below is a summary table from chapter 14 of our General Chemistry textbook.
Table 3.1 (Lab) Summary of Reaction Rates
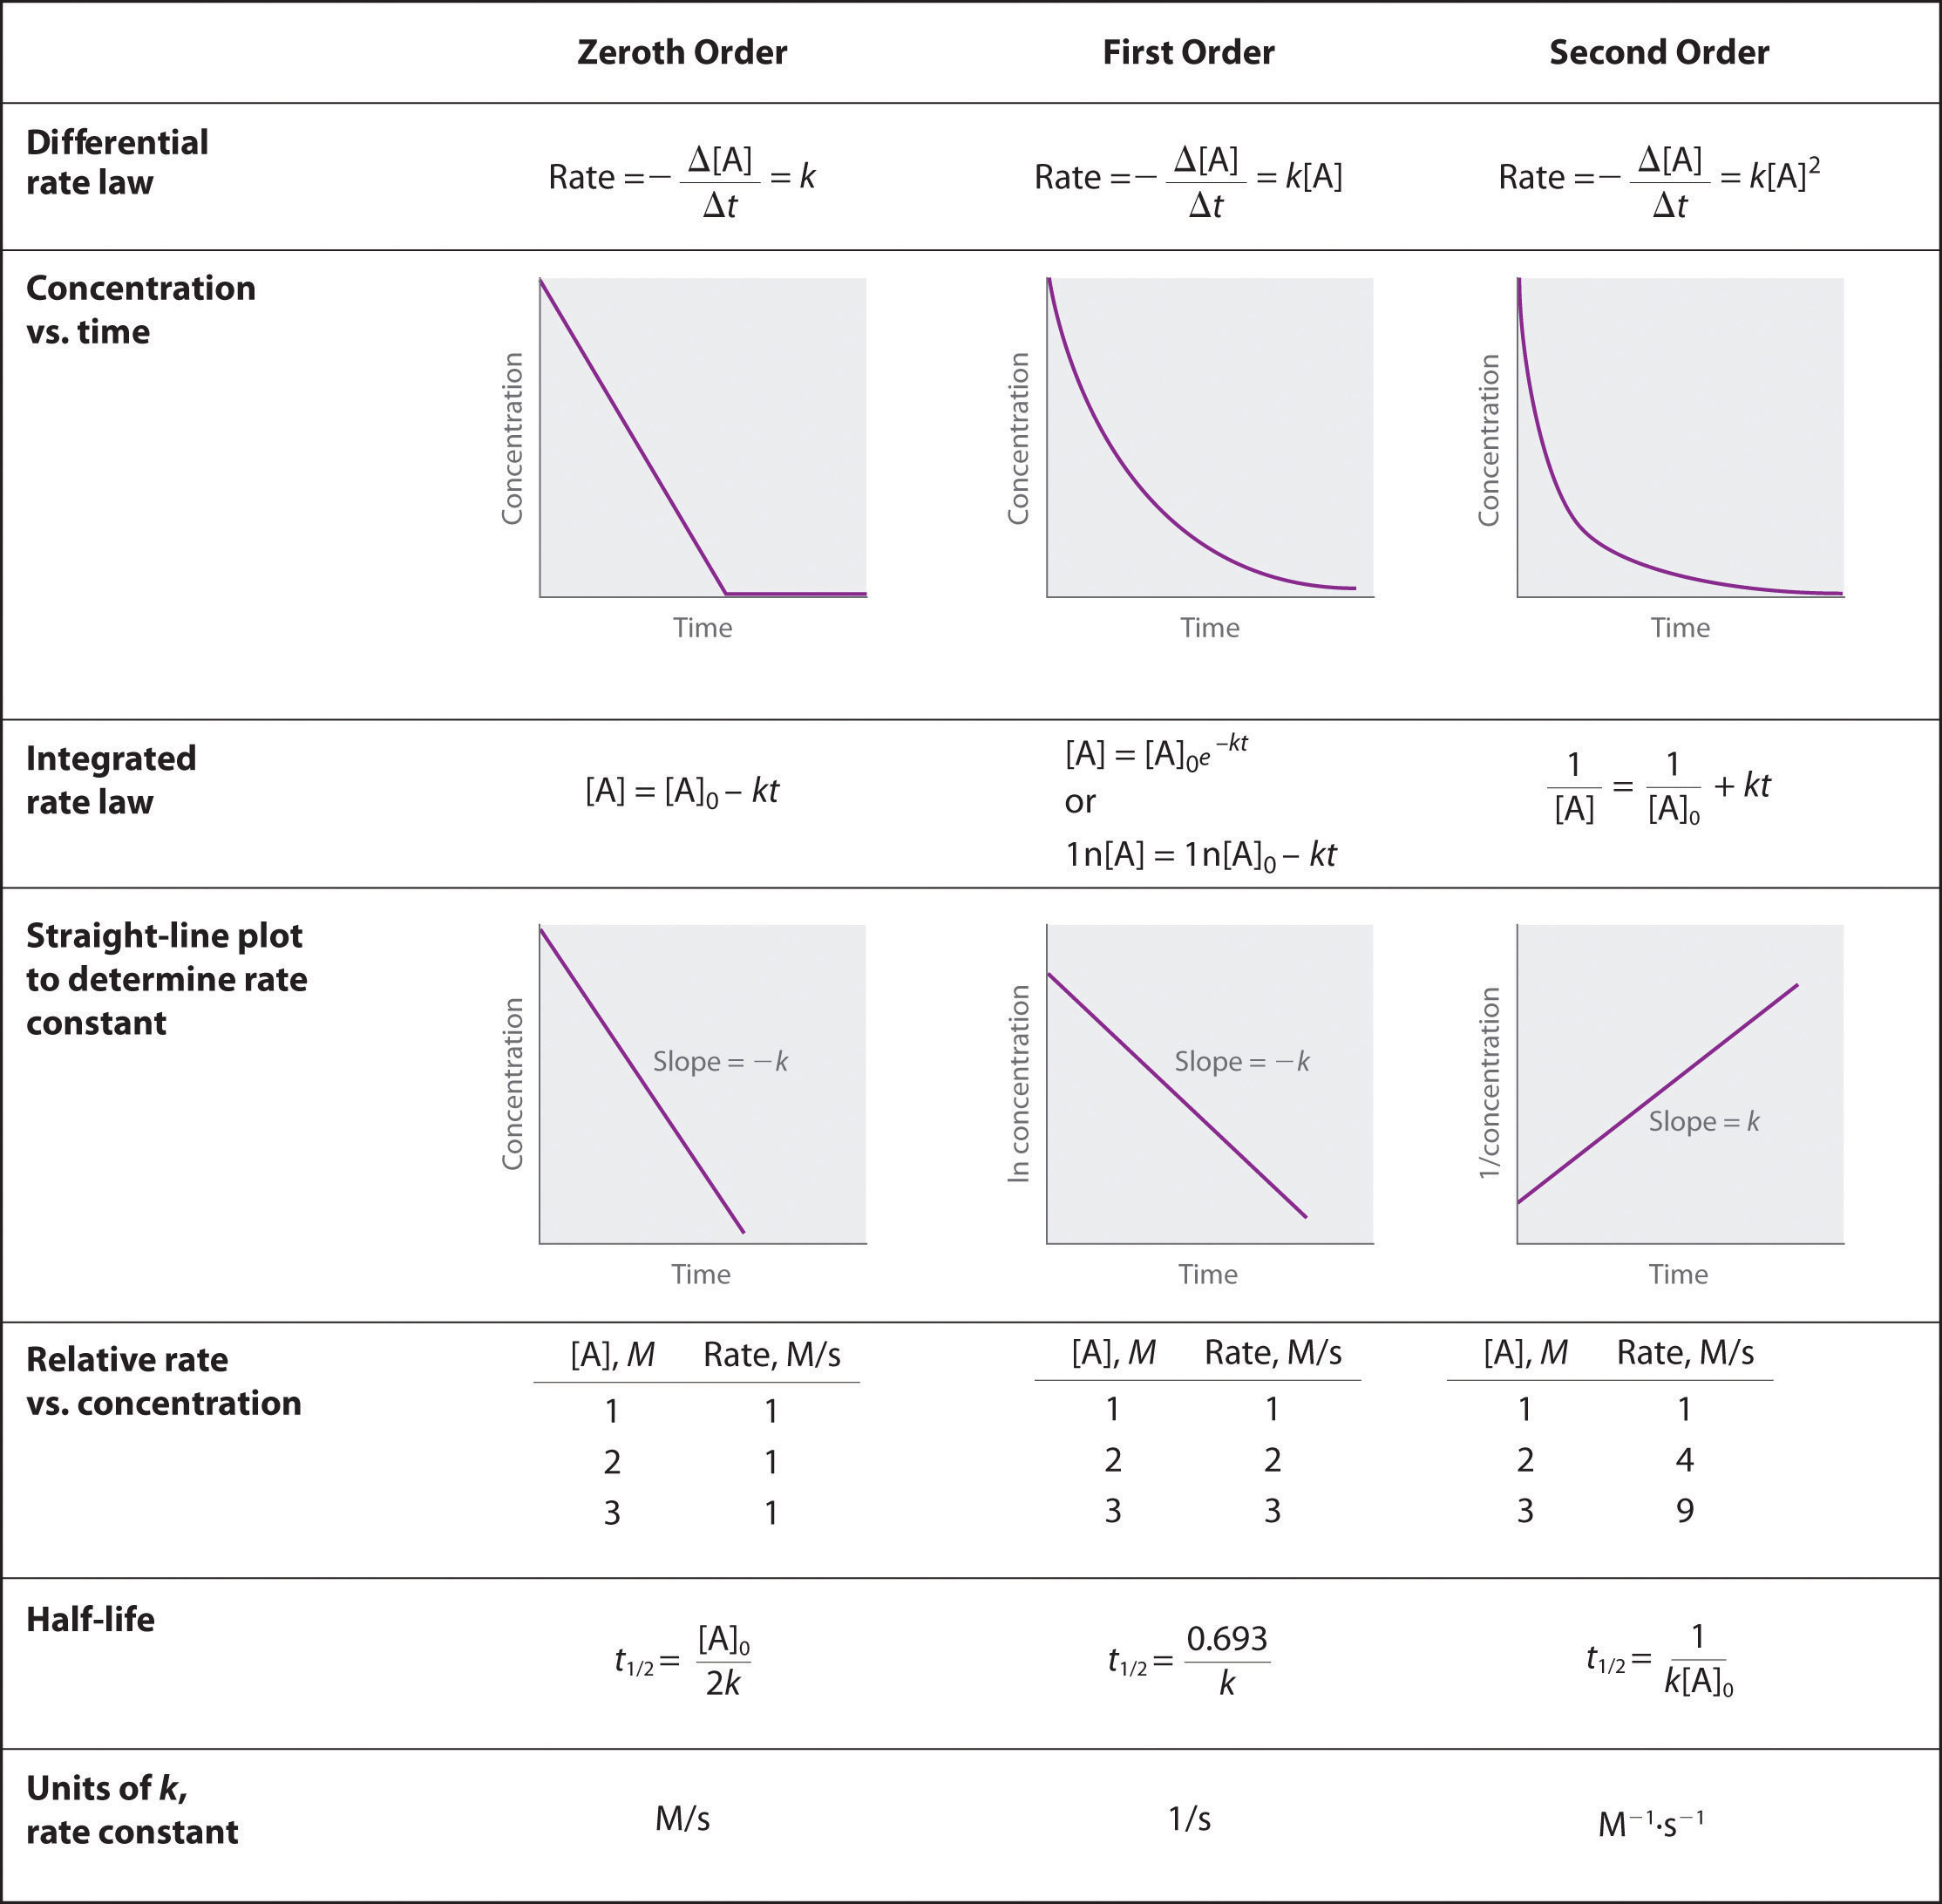
In Gen Chem II lab we performed several experiments to measure the rate law. For example, we measured how long it took for the purple color potassium permanganate to disappear during the oxidation of oxalic acid. We also measured the rate of acetyl salicylic acid (aspirin) hydrolysis using the UV-vis spectrophotometer. As always in the lab, we need an observable. And for this experiment our observable is the rotation of plane-polarized light. This is why it's called "invert" sugar. The direction of plane-polarized lights rotation is opposite in invert sugar as it was for regular sugar. Now let's consider how we measure this phenomenon.
The Polarimeter
Figure 3.3 (Lab) Polarimetry in a Sugar Beet Processing Factory
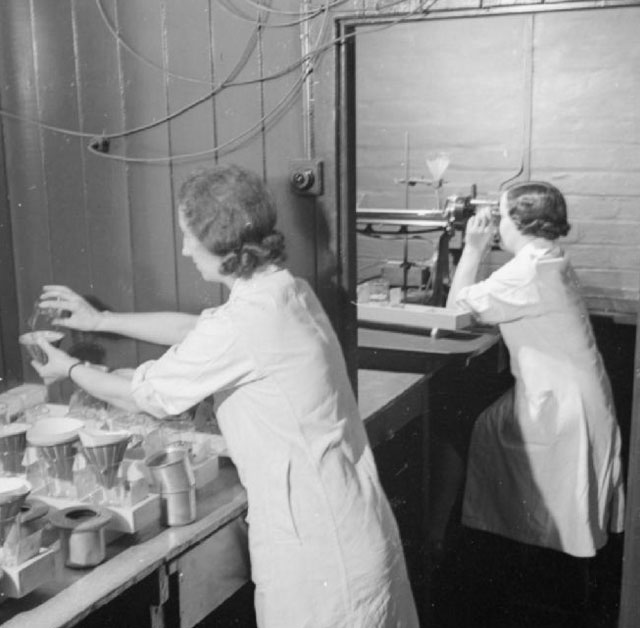
Producing Your Sugar- the Growing and Processing of Sugar Beet, Britain, 1942 Women work in the 'tare house' laboratory to determine the sugar content of a sample of sugar beet, taken from a load which has just been brought in. The sugar solution is filtered and tested in a polarimeter, which shows automatically the average percentage of sugar content in the sample. These results can then be used to work out the average sugar content in the load of clean beet from which the original sample was taken.By Ministry of Information Photo Division Photographer, Stone Richard [Public domain], via Wikimedia Commons
A schematic representation of a polarimeter appears in figure 4.2-2 (below):
Figure 3.4 (Lab) A Polarimeter
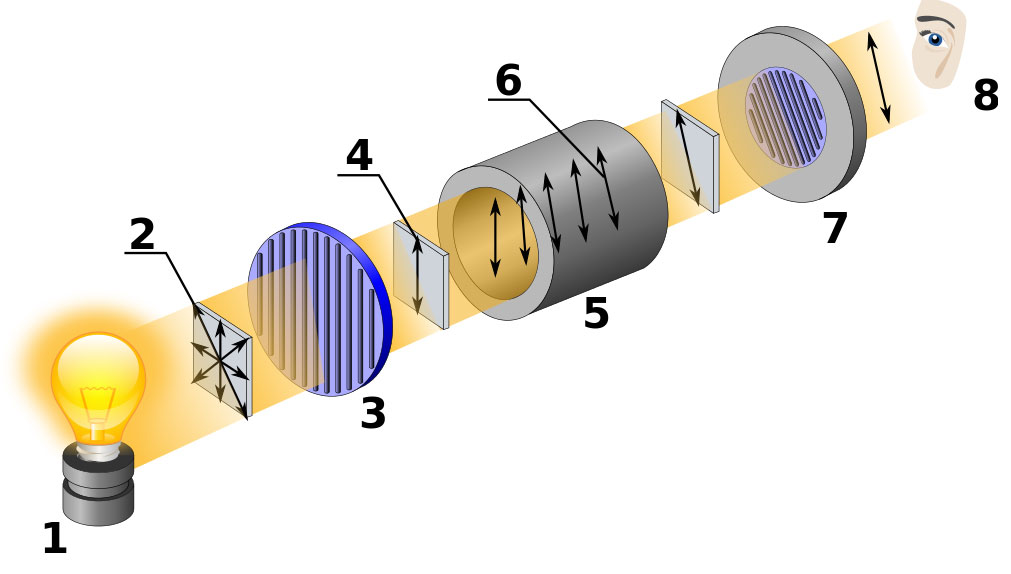
(1) Light source, (2) Ordinary unpolarized light, (3) Polarizer, (4) Vertically polarized light, (5) Sample Tube, (6) The plane of polarized light is rotated from vertical by the optically active sample, (7) Analyzer ring that is rotated by the observer until it aligns with the plane of polarized light, (8) observer. By Kaidor [CC BY-SA 3.0 (http://creativecommons.org/licenses/by-sa/3.0) or GFDL (http://www.gnu.org/copyleft/fdl.html)], via Wikimedia Commons
The amount of rotation is a characteristic of a particular optically active compound. The value of the amount of rotation is recorded in the literature as specific rotation. Specific rotation, [α], is defined as the angle of rotation of plane polarized light by a sample contained in a 1 dm tube at a concentration of 1 g / 100 mL solution. To compare the value for the rotation that you observe, αobs, with the literature one uses the following relationship.
Where c is the concentation in g/100 mL and l is the path length in dm.
Although our instrument is about 50 years newer, it looks and works pretty much the same as this figure from an 1899 textbook.
Figure 3.2 (Lab) Polarimeter and Light Source
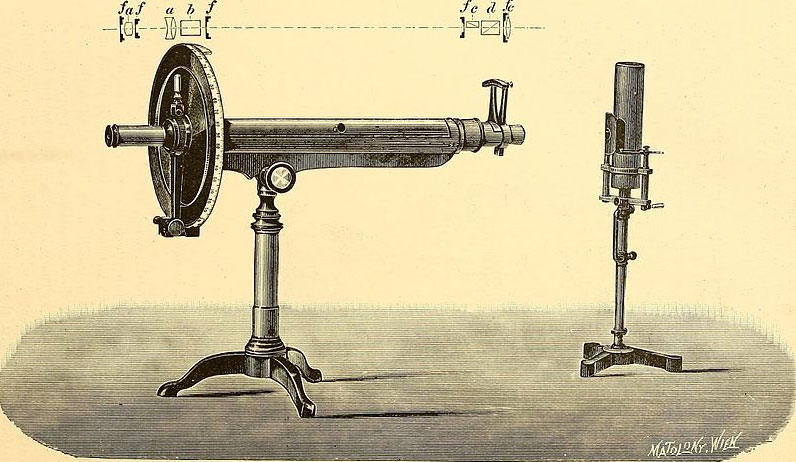
From Clinical diagnosis : the bacteriological, chemical, and microscopical evidence of disease, 1899. By Rudolph Jaksch, via Wikimedia Commons
Below are pictures of our instrument.
Figure 3.3 (Lab) Source Side of Highland's Polarimeter
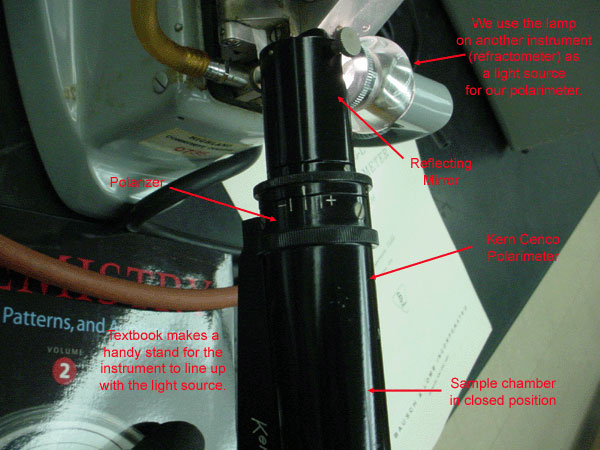
Note the polarizer is turned to the netural position.
Figure 3.3 (Lab) Eyepiece Side of Highland's Polarimeter
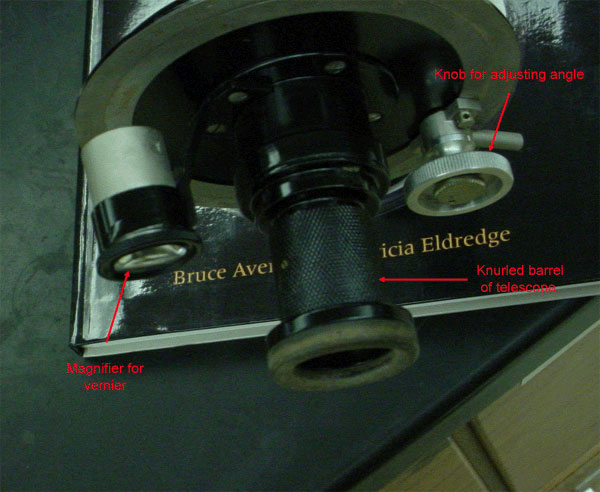
Note there are two places for your eyes. The telescope is used to observe the beam from the source through the sample, the magnifier is used to take a reading off the scale.
Obtaining a Zero Point
Let the light source warm up for 5 minutes.
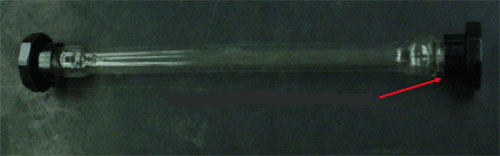
Remove the screw-cap (lefty-loosey) from either end of the 20-cm sample tube. Be gentle. Remember this plastic is older than your instructor. There is a small glass disk that fits between the screw cap and the tube. Sometimes the glass disk sticks to the tube, sometimes to the cap. Don't let this disk go down the drain when you empty the tube. Fill the tube with DI water.
Figure 3.4 (Lab) Sample Tube
GENTLY screw on the cap. Righty-tighty but not too tight. It's easy to accidently strip plastic threads.
Place filled sample tube in sample holder.
Figure 3.4 (Lab) Sample Chamber Open with Sample Tube Loaded
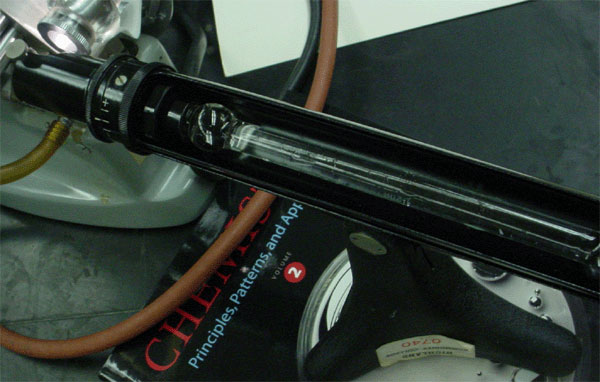
Rotate the cover closed.
Focus the telescope by moving the barrel in or out (DO NOT ROTATE).
The image in the telescope now has three regions. Two lateral regions appear on either side of a central region.
Figure 3.5 (Lab) View Through the Telescope
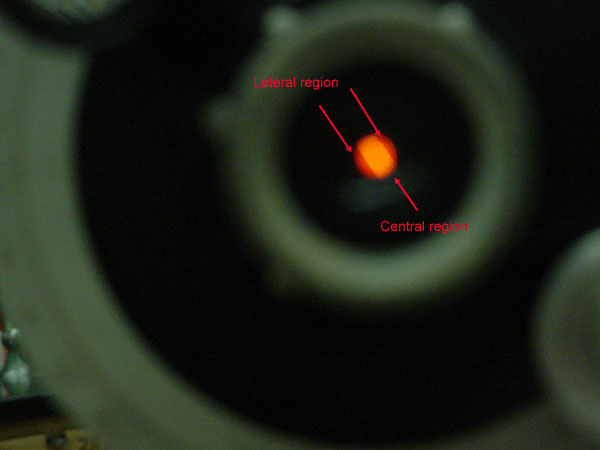
Turn the knob to adjust the angle (not the eyepiece). Doing so, makes the intensity of the central region and the lateral regions change. Your goal in turning the knob is to get the central region the same darkness (lightness) as the lateral regions. When you get to the pivot point, a tiny change of the angle will reverse the image darkness.
Look into the magnifier at the vernier and take a reading (see below). This is your ZERO POINT.
Figure 3.6 (Lab) View Through the Magnifier
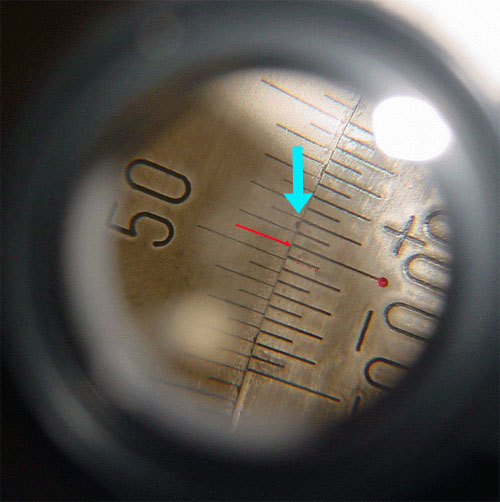
The line indicated with the red dot says that your reading is a little more than 50.5 degrees as read from the top. Just how much more is read from the bottom scale. Find the line on the bottom scale that matches up with any line above. In this case, the blue arrow is showing the 0.1 place is lining up best. So add 0.1 to 50.5 and your zero point reading would be 50.6 degrees.
Measuring the Specific Rotation for a Compound.
Part 2's actually easier than part 1 since you should now be familiar with the components of the instrument.
- Adjust the instrument to the Zero Point determined in part 1.
- Rinse sample tube with sample solution.
- Fill the sample tube with sample solution.
- Put the sample solution into the polarimeter and close the cover.
- Without rotating the eyepiece, push or pull the telescope to focus.
- Rotate the knob until the three areas in the image have the same darkness.
- Look through the magnifier and read the vernier.
- Subtract the zero point from the angle you measure. Do the operation in exactly that order (angle you measure for the sample - zero point). Sometimes this will give a negative result. Sometimes this will be a positive result. It depends on the enantiomeric identity of the sample.
The Experiment
- Dissolve 5 g of sucrose in water and dilute to 25 mL.
- Mix with 25 mL of 4M HCl. Record the time. At this point, the reaction has started so work quickly to get your first reading. Like most kinetics experiments, the early data is the best data.
- Wearing gloves, fill the 20 cm polarimeter tube with the acidified sugar water. Pop the tube in the polarimeter, adjust the polarimeter with the knob until the central and lateral regions are the same, record the time and then take a reading.
- Continue taking readings every 5 minutes or so until the data is no longer changing.
- Leave the tube in the chamber for another hour. Then take one last very important reading. This is your infinite time reading.
The Math
It can be shown
where α is the observed rotation, α∞is the observed rotation at infinite time, k is the observed rate constant, t is the time and α0 is the observed rotation at the time of mixing. Of course, be sure to subtract your zero point reading from all your angles of rotation before making a graph.
Scoring
Lab Notebook (6 points)
- Zero point (sig figs)
- Sufficient observed rotations (sig figs).
- Infinite time point (sig figs).
- Mass of sugar.
- Volume of soln.
- What was mixed?
Formal Lab Report (24 points)
- Introduction: A paragraph including background (historical or everyday importance).
- Experimental: Extremely brief procedulre including source of chemicals, name of instrument manufacturer. If this is more than 3 sentences it's too long.
- Results and Discussion: Graph of data. Statement of experimentally determined rate constant. Include an electron flow diagram of a proposed reaction mechanism using conventional curved arrow formalism. Label all elementary steps in the propsed mechanism. Which steps in the mechanism are first order, which are second order.
- Conclusion: What other related experiments would you do if you had more time?