This is "Spectroscopic Detection of Chlorine and Bromine in Organic Compounds" from the book 32 Weeks of OChem (v. 1.0).

Has this book helped you? Consider passing it on:
Creative Commons supports free culture from music to education. Their licenses helped make this book available to you.
DonorsChoose.org helps people like you help teachers fund their classroom projects, from art supplies to books to calculators.

Spectroscopic Detection of Chlorine and Bromine in Organic Compounds

Finding Nemo, the fish and the movie

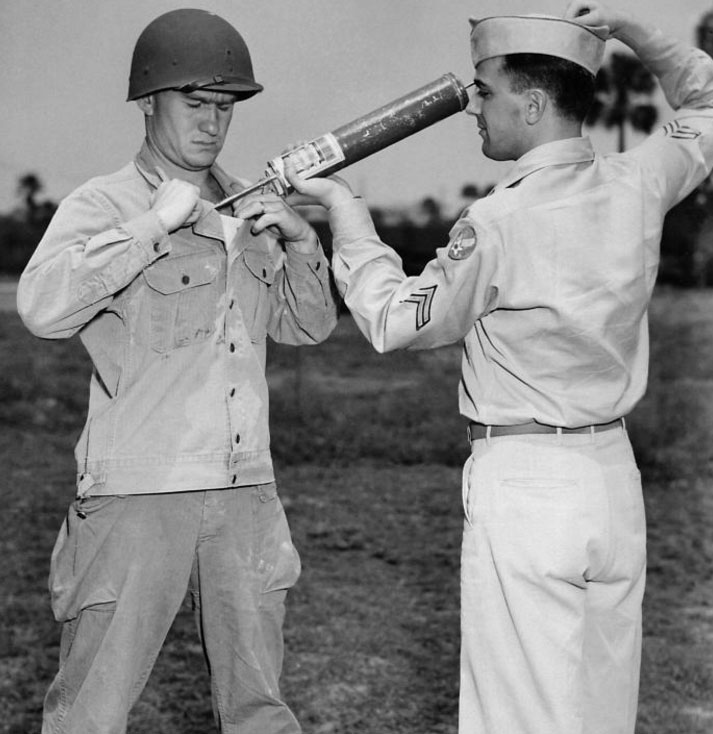
A U.S. soldier is demonstrating DDT-hand spraying equipment while applying the insecticide.

The use of DDT increased enormously on a worldwide basis after World War II, because of its effectiveness against the mosquito that spreads malaria and lice that carry typhus. The World Health Organization claims that the use of DDT saved 25 million lives.

During World War I typhus caused three million deaths in Russia and more in Poland and Romania. De-lousing stations were established for troops on the Western front but the disease ravaged the armies of the Eastern front, with over 150,000 dying in Serbia alone. Fatalities were generally between 10 to 40 percent of those infected, and the disease was a major cause of death for those nursing the sick. Between 1918 and 1922 typhus caused at least 3 million deaths out of 20–30 million cases. In Russia after World War I, during the civil war between the White and Red armies, typhus killed three million, largely civilians. Even larger epidemics in the post-war chaos of Europe were only averted by the widespread use of the newly discovered DDT to kill the lice on millions of refugees and displaced persons.By Image and description Content Providers(s): CDC [Public domain], via Wikimedia Commons

ddt's name and structure

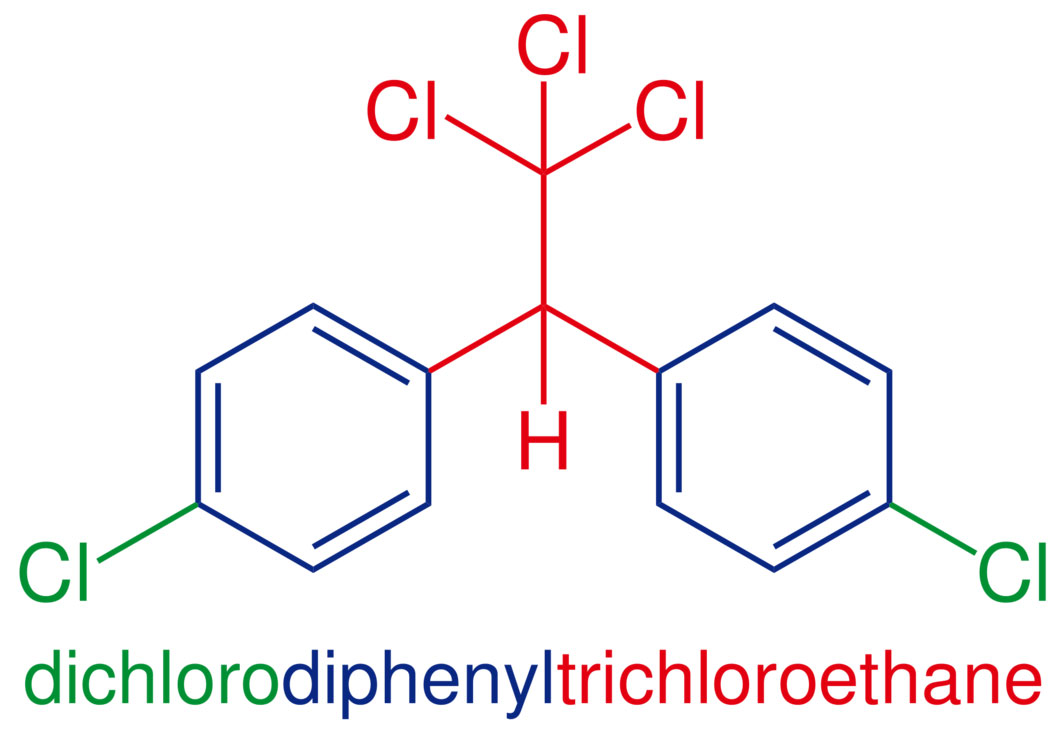
By Leyo (Own work) [Public domain], via Wikimedia Commons

Learning Objectives

  1. To interpret a mass spectrum of a compound which may contain chlorine or bromine.
  2. To know characteristic IR bands for compounds containing chlorine or bromine.
  3. To be able to associate 13C and 1H NMR chemical shift information with the presence of chlorine or bromine atoms in a compound.

Way back in general chemistry we learned the valence of a halogen is one. Meaning a chlorine or a bromine atom forms one bond in neutral compounds.

MS

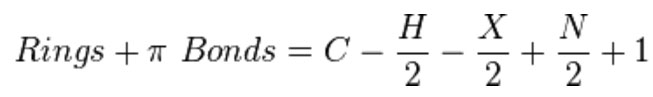
The monovalent nature of of any halogen means it replaces an H in our molecular formula. The halogen atoms conveniently have odd masses. This means our nitrogen rule holds even in the presence of any number of halogen atoms. The molecular ion has an even numbered mass except for the cases of the presence of an odd number of nitrogens. Recall, the r+db formula.

rings + double bonds = C-(H/2)-(X/2) + (N/2) + 1

There is however a striking feature that is remarkably different when it comes to the mass spectrum of a compound with chlorine or bromine. That feature is the M+2 peak. Chlorine comes in two flavors, 35 amu and 37 amu. Bromine comes in two isotopic flavors, 79 amu and 81 amu. And the abundance of the heavy isotopes is ginormous compared to paltry 13C/12C (1.1%) or 18O/16O (0.2%) abundances.

37Cl/35Cl = 31.9%

81Br/79Br = 97.3%

This makes the presence of just one chlorine or bromine atom in the spectrum rather obvious. Consider the spectra below.

Figure 5.1 (Spec) Infrared Spectrum of a Chloroalkane

FTIR

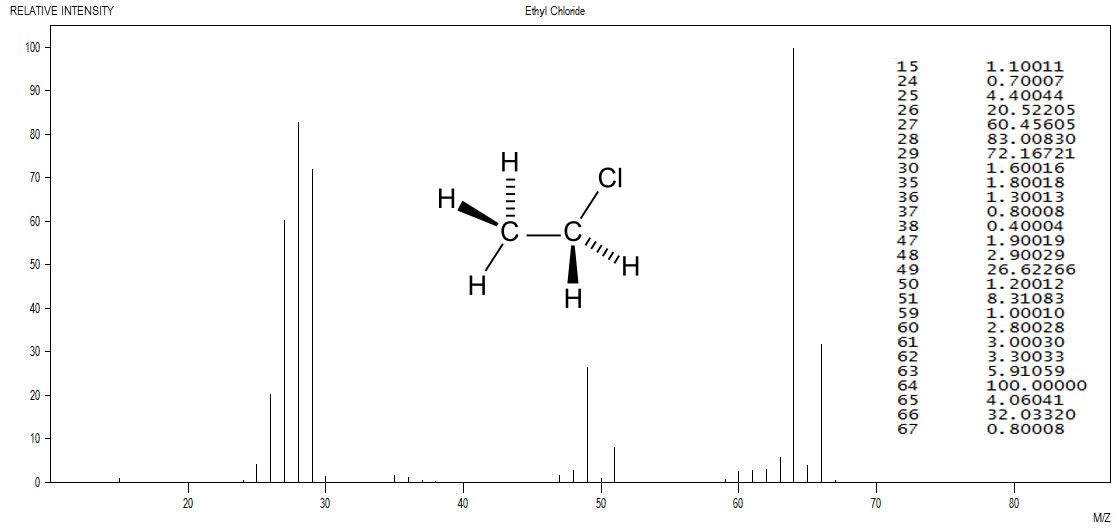
The M+2 peak is between a quarter and a third the intensity as the M+ peak. Such a pattern is a clear indication of the presence of a single chlorine atom. Data from the NIST was plotted with the JDXview program. The data table, also from the NIST was overlaid upon the spectrum along with the structure from Wikipedia.

Figure 5.2 (Spec) Infrared Spectrum of an Bromoalkane

FTIR

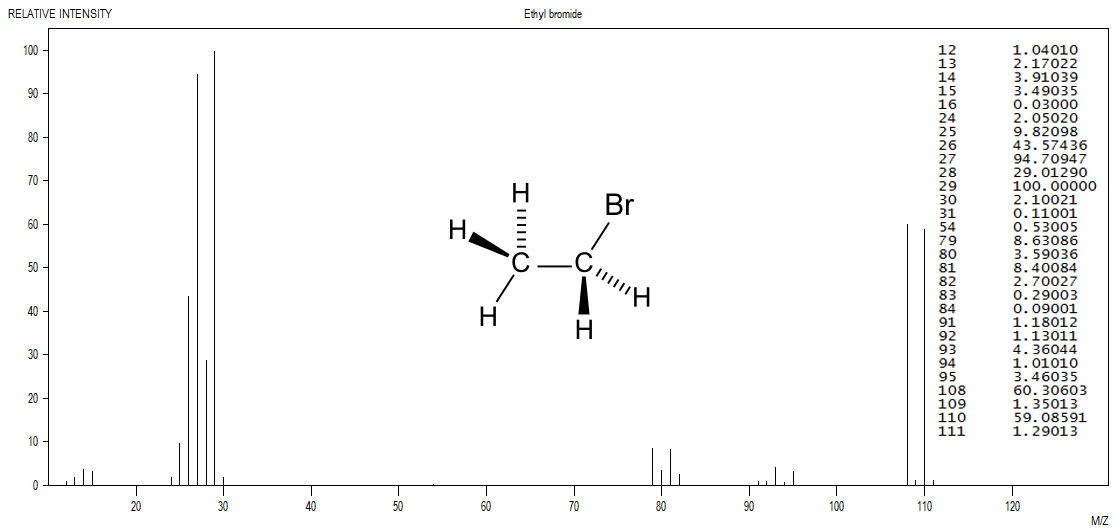
The M+ peak is nearly the same intensity as the M+2 peak. Such a pattern is a clear indication of the presence of a single bromine atom. Data from the NIST was plotted with the JDXview program. The data table, also from the NIST was overlaid upon the spectrum along with the structure from Wikipedia.

If more than one chlorine and/or bromine is present, the parent ion peak group gets more complex, though the possible patterns certainly remain distinctive. A very cool JavaScript program from T. W. Shattuck at Colby College is pasted below:

Formula: C H N O F Cl Br I
Alkali, Alkaline Earth:    []          []
Representative 3rd:      []           []   
Representative 4th:   []        []
Transition Metals:     []        []   


e/o = even/odd electrons assuming electron impact ionization
dbr = double bonds and rings

  • If the trial formula is CcHhOoNn then the number of double bonds and rings is (2c-h+n+2)/2.
  • [ ] The expected valence for the dbr and e/o calculations is given in the brackets. You can change these values. For example, S can be [2] or [6].
  • Rounding for integer mass assumes a resolution of 0.20. That is, 0.81 amu rounds up, but 0.80 rounds down. Check the exact value for the smallest mass peak to be sure.
  • Parent mass calculated using the masses of the most abundant isotopes.
  • IE Users: To print the spectrum, press [Ctrl]P with the spectrum window active.
  • Isotopic abundances from Web-Elements.

T. W. Shattuck, Colby College Chemistry and Los Alamos National Laboratory, 11/19/2000

IR (FTIR)

C-Cl and C-Br stretches

The Cl and Br atoms are quite heavy compared to hydrogens, carbons and oxygens. So the stretching frequencies of the absorption is at a much lower frequency. Look for the C-Cl stretching as an intense band between 850 and 550 cm-1, while the C-Br stretch will be between 690 and 515 cm-1.

CH2-Cl and CH2-Br wagging

If there's a methylene group attached to the halogen, expect a CH2-wagging band to appear between 1300 and 1150 cm-1.

Figure 4.1 (Spec) Infrared Spectra of Some Organic Halogen Compounds

FTIR

The red line spectrum (upper most) is of ethyl chloride and the black line (lower most) is the spectrum for ethyl bromide. NIST data plotted with Spekwin32.

NMR

Neither the 1H NMR nor the 13C NMR spectra will be a lot of help for spotting Cl or Br atoms. Sometimes the integration of the 1H NMR can leave holes in the formula since the halogen atoms take the place of hydrogens. In the DEPT and off resonance 13C experiments can be explained with the presence of a halogen. For example, the -CH2Cl carbon would show up as a CH2 with an inverted peak in the DEPT. Later in the course we will see the presence of halogens can also explain splitting patterns in the 1H NMR spectrum.

Example 4.1 (spec)

Identify the unknown compound using the following four spectra.

Figure 4.5 (Spec) Mass Spectrum

Mass Spectrum

Figure 4.6 (Spec) IR Spectrum

IR Spectrum

By SDBSWeb : http://sdbs.db.aist.go.jp (National Institute of AdvancedIndustrial Science and Technology), accessed August 15, 2017

Figure 4.7 (Spec) 13C NMR Spectrum

13C NMR with 4 signals: 50, 37, 29, 16

By SDBSWeb : http://sdbs.db.aist.go.jp (National Institute ofAdvancedIndustrial Science and Technology), accessed August 15, 2017

Figure 4.8 (Spec) 1H NMR Spectrum

proton NMR spectrum, 3 signals, 2.8, 1.1, 0.8

By SDBSWeb : http://sdbs.db.aist.go.jp (National Institute ofAdvancedIndustrial Science and Technology), accessed August 15, 2017

Answer

Step 1: Identify the probable M+ ion in the mass spectrum (Figure 4.5 (Spec)). The most likely candidate is at 101 m/z. The 13C isotopic peak looks like it is buried in the noise so we are unable to use it to calculate the number of carbon atoms. We are however reassured that 101 is the M+ by the presence of the base peak at M-15, which is 86 m/z. ding 100 by the intensity at 88. The fact that 101 is an odd number and we have major fragments at 86, 70 and 58 m/z leads us to suspetc the presence of an odd number of nitrogen atoms.

Step 2: The MS gives us a pretty good idea the molecular weight of our unknown is 101; however, it does not allow us to calculate a molecular formula. So for this unknown, we ought to take a look at the 1H NMR (FIgure 4.8 (Spec)) integration and see how many protons might be in our compound. It looks like 15 protons. With 15 amu from the protons and 14 amu from the nitrogen, we'd need 72 amu to get to 101. That would mean 6 carbons and a probable molecular formula would be C6H15N. What about an oxygen or two? One oxygen would leave 56 amu for carbon and that's not a multiple of 12. Two oxygens would leave 48 amu for carbon. That would work. So another likely molecular formula would be C4H15NO2.

Step 3: Applying the rings + double bonds formula to either C6H15N or C4H15NO2 gives 0 rings or double bonds.

Step 4: Checking the IR (Figure 4.6 (Spec)), the band at 3220 cm-1 makes us think the N-H stretch of a secondary amine. This is confirmed by the C-N stretch at 1220 cm-1, the lack of a significant N-H scissoring at 1610 cm-1 and the broad band around 690 cm-1 associated with N-H wagging. Further, the band at 1520 cm-1 indicates a secondary amine and not a primary amine since it is a single sharp band at a lower wavenumber than one would expect for a primary amine (and it's not a doublet). Nothing in the IR indicates the presence of oxygen. There's no Santa's belly so it's definitely not an alcohol. There could be some sneaky ether functionality. C-O stretches and C-N stretches look similar.

Step 5: We still need to nail down our molecular formula. Let's consider the 1H NMR (Figure 4.8 (Spec)). If there is an ether functionality we'd see a peak around 3 or 4 ppm. The closest thing is at 2.6, but that is more attributable to an H on a carbon attached to a nitrogen. It's now safe to say there's no oxygen. Our molecular formula is definitely C6H15N.

Step 6: Consider the 13C NMR (Figure 4.7 (Spec)). We see 4 distinct peaks. The signal at 51 ppm is clearly from a carbon connected to a nitrogen. We know it's a secondary amine, so the peak at 36 must also be from a carbon attached to a nitrogen. The peak at 29 and the peak at 16 must be from carbons distant. The fact that there are 4 distinct peaks indicates some symmetry in the molecule. The peak at 3.7 ppm is maybe a little high for an ether, but still within the range indicated in Figure 3.3 (Spec).

Step 7: Pause and consider the possibilities by drawing structural isomers of C6H15N that are secondary amines and possess symmetry that presents just four distinct carbons.

Figure 4.9 (Spec) Structures of Candidates

Structures of isomers of C6H15N

Reconsidering the 1H-NMR with an eye again at the integration. The interation of 1 at around 0.8 ppm must be from the hydrogen on the nitrogen. The 9 + 3 integration at 1.1 ppm could be the H's of a tert-butyl group and the integration of 2 from the protons on a methylene (-CH2-) group. Unfortunately, this integration is completely consistent with both choices. The presenece of the tert-butyl group is confirmed in the IR spectrum (Figure 4.6 (Spec)) by the doublet in the 1350-1385 cm-1 region.

And it appears we are stuck. There are a couple of good observations we could make that would let us distinguish these two. We could look at the fragmentation pattern in the MS. We could also look at the peak splitting patterns in the 1H NMR. Unfortunately, these will have to wait until a little later in the semester. So, at this point in our learning, the best we can do is guess. Or, we could look them up in the SDBS, but that's cheating!